Fig. 4.
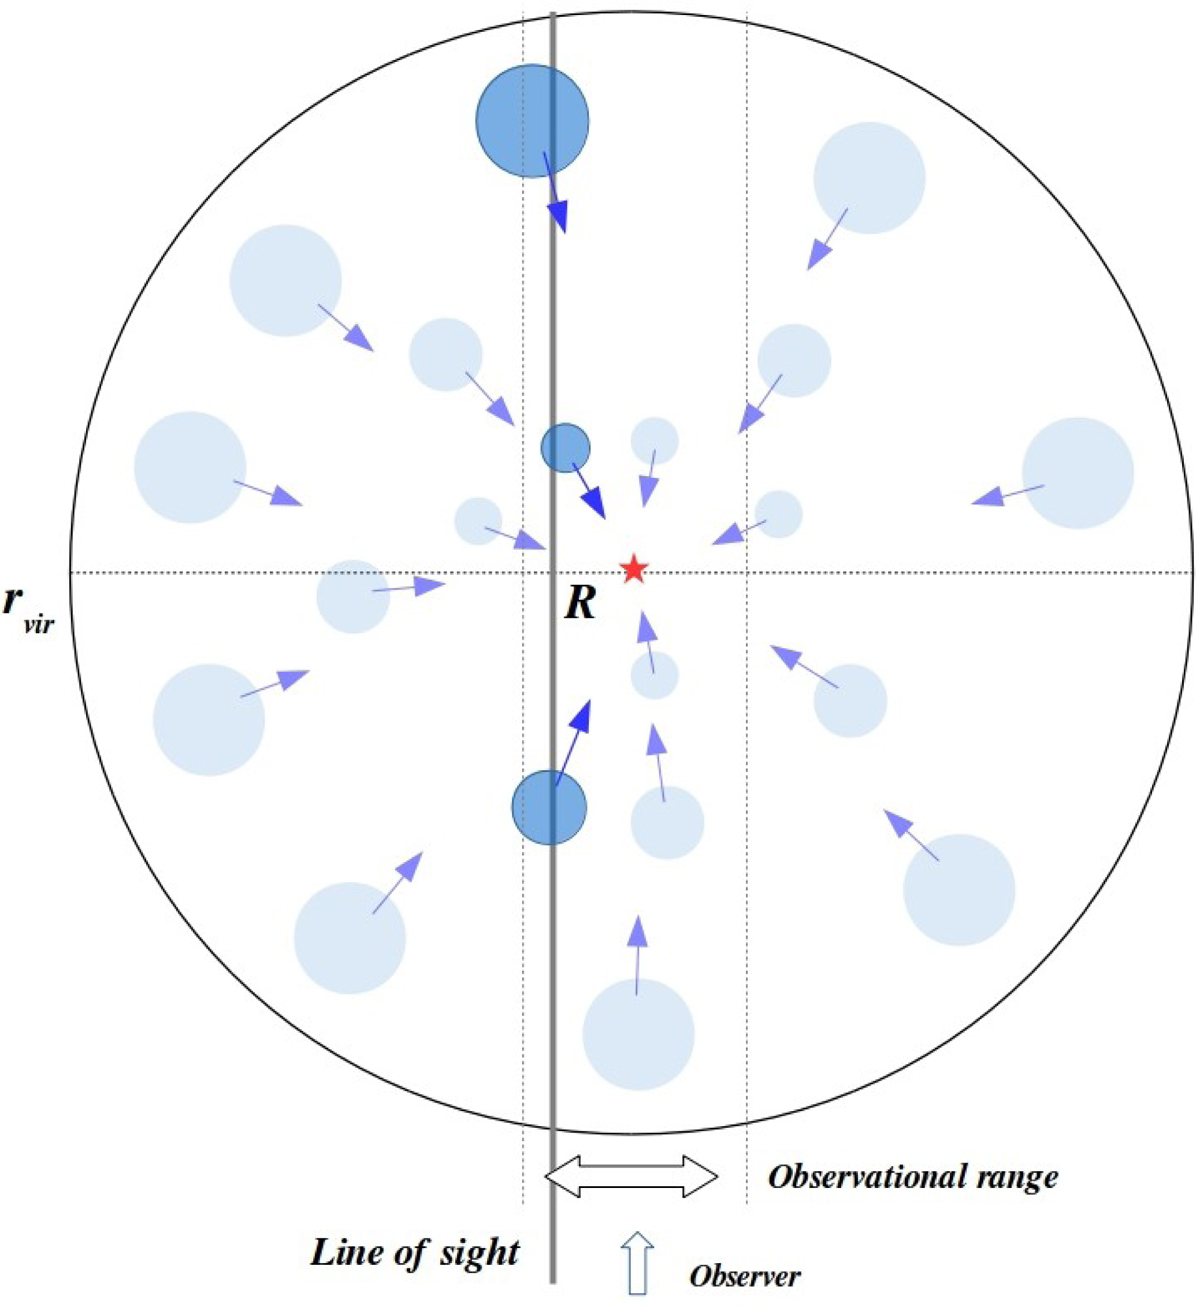
Cartoon 2D representation of the synthetic observations performed in our model. The clouds (blue circles) are distributed throughout the halo (the sphere with radius rvir), all accreting towards the central galaxy (the central red star) with a radial velocity described by Eq. (12). The vertical gray line represents the line of sight, consistent with the projected distance R of the galaxy from the background quasar, while the area included between the two vertical dashed lines represents the range spanned by the COS-LRG observations. The observer is located at the bottom side of the panel.
Current usage metrics show cumulative count of Article Views (full-text article views including HTML views, PDF and ePub downloads, according to the available data) and Abstracts Views on Vision4Press platform.
Data correspond to usage on the plateform after 2015. The current usage metrics is available 48-96 hours after online publication and is updated daily on week days.
Initial download of the metrics may take a while.