Fig. 6.
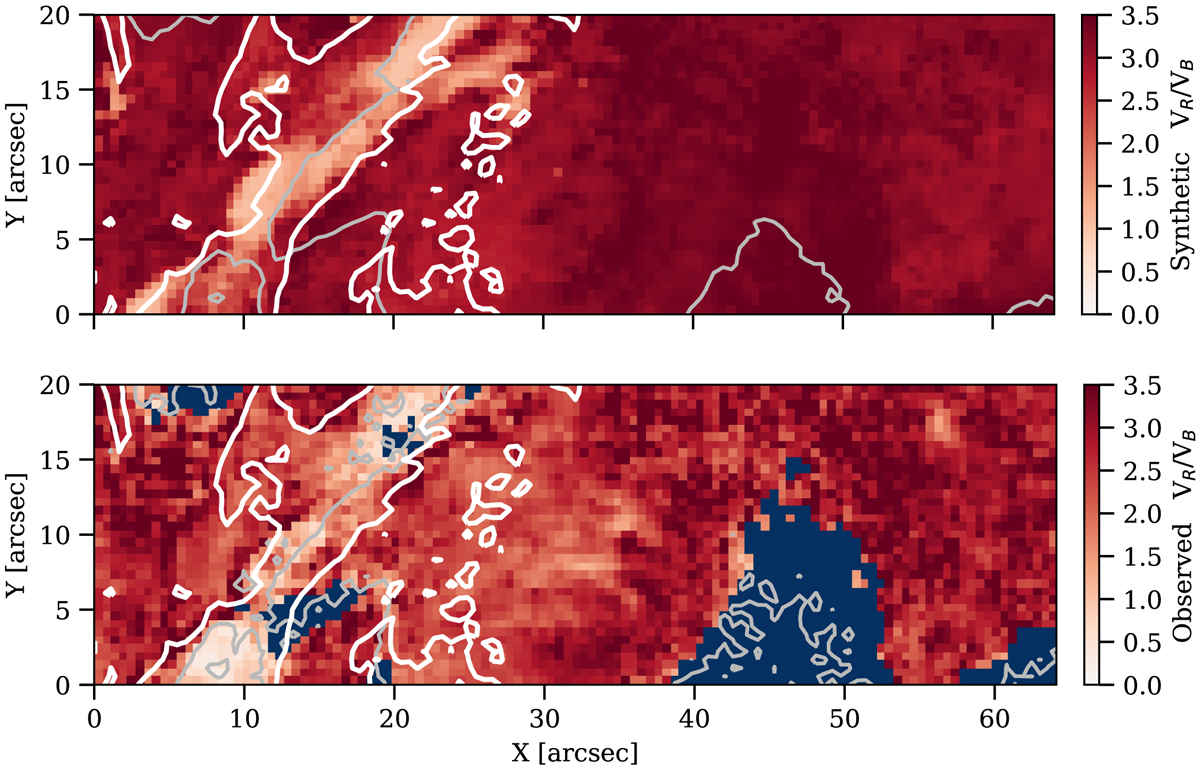
Upper panel: map of the ratio of the amplitudes of the circular polarization between the red and blue components calculated using the synthetic profiles from the HAZEL fit. Lower panel: same ratio, but calculated from the observed signals, masking the signals below 1.5σ. The gray line indicates the PIL, while the white contour indicates the filament location.
Current usage metrics show cumulative count of Article Views (full-text article views including HTML views, PDF and ePub downloads, according to the available data) and Abstracts Views on Vision4Press platform.
Data correspond to usage on the plateform after 2015. The current usage metrics is available 48-96 hours after online publication and is updated daily on week days.
Initial download of the metrics may take a while.