Free Access
Fig. 3.
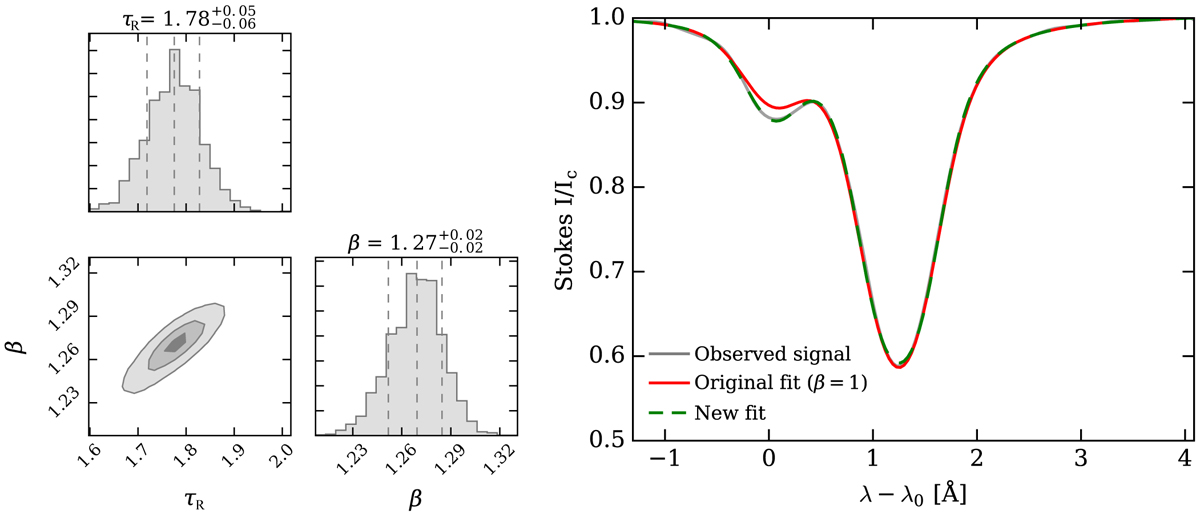
Bayesian estimation of the β parameter. Left panel: posterior probability distribution of β and τR, and the correlation between them. Right panel: improved fit of the blue component of the He I triplet when going from τR = 1.2, β = 1.0 (red line) to τR = 1.8, β = 1.3 (green line).
Current usage metrics show cumulative count of Article Views (full-text article views including HTML views, PDF and ePub downloads, according to the available data) and Abstracts Views on Vision4Press platform.
Data correspond to usage on the plateform after 2015. The current usage metrics is available 48-96 hours after online publication and is updated daily on week days.
Initial download of the metrics may take a while.