Fig. 9.
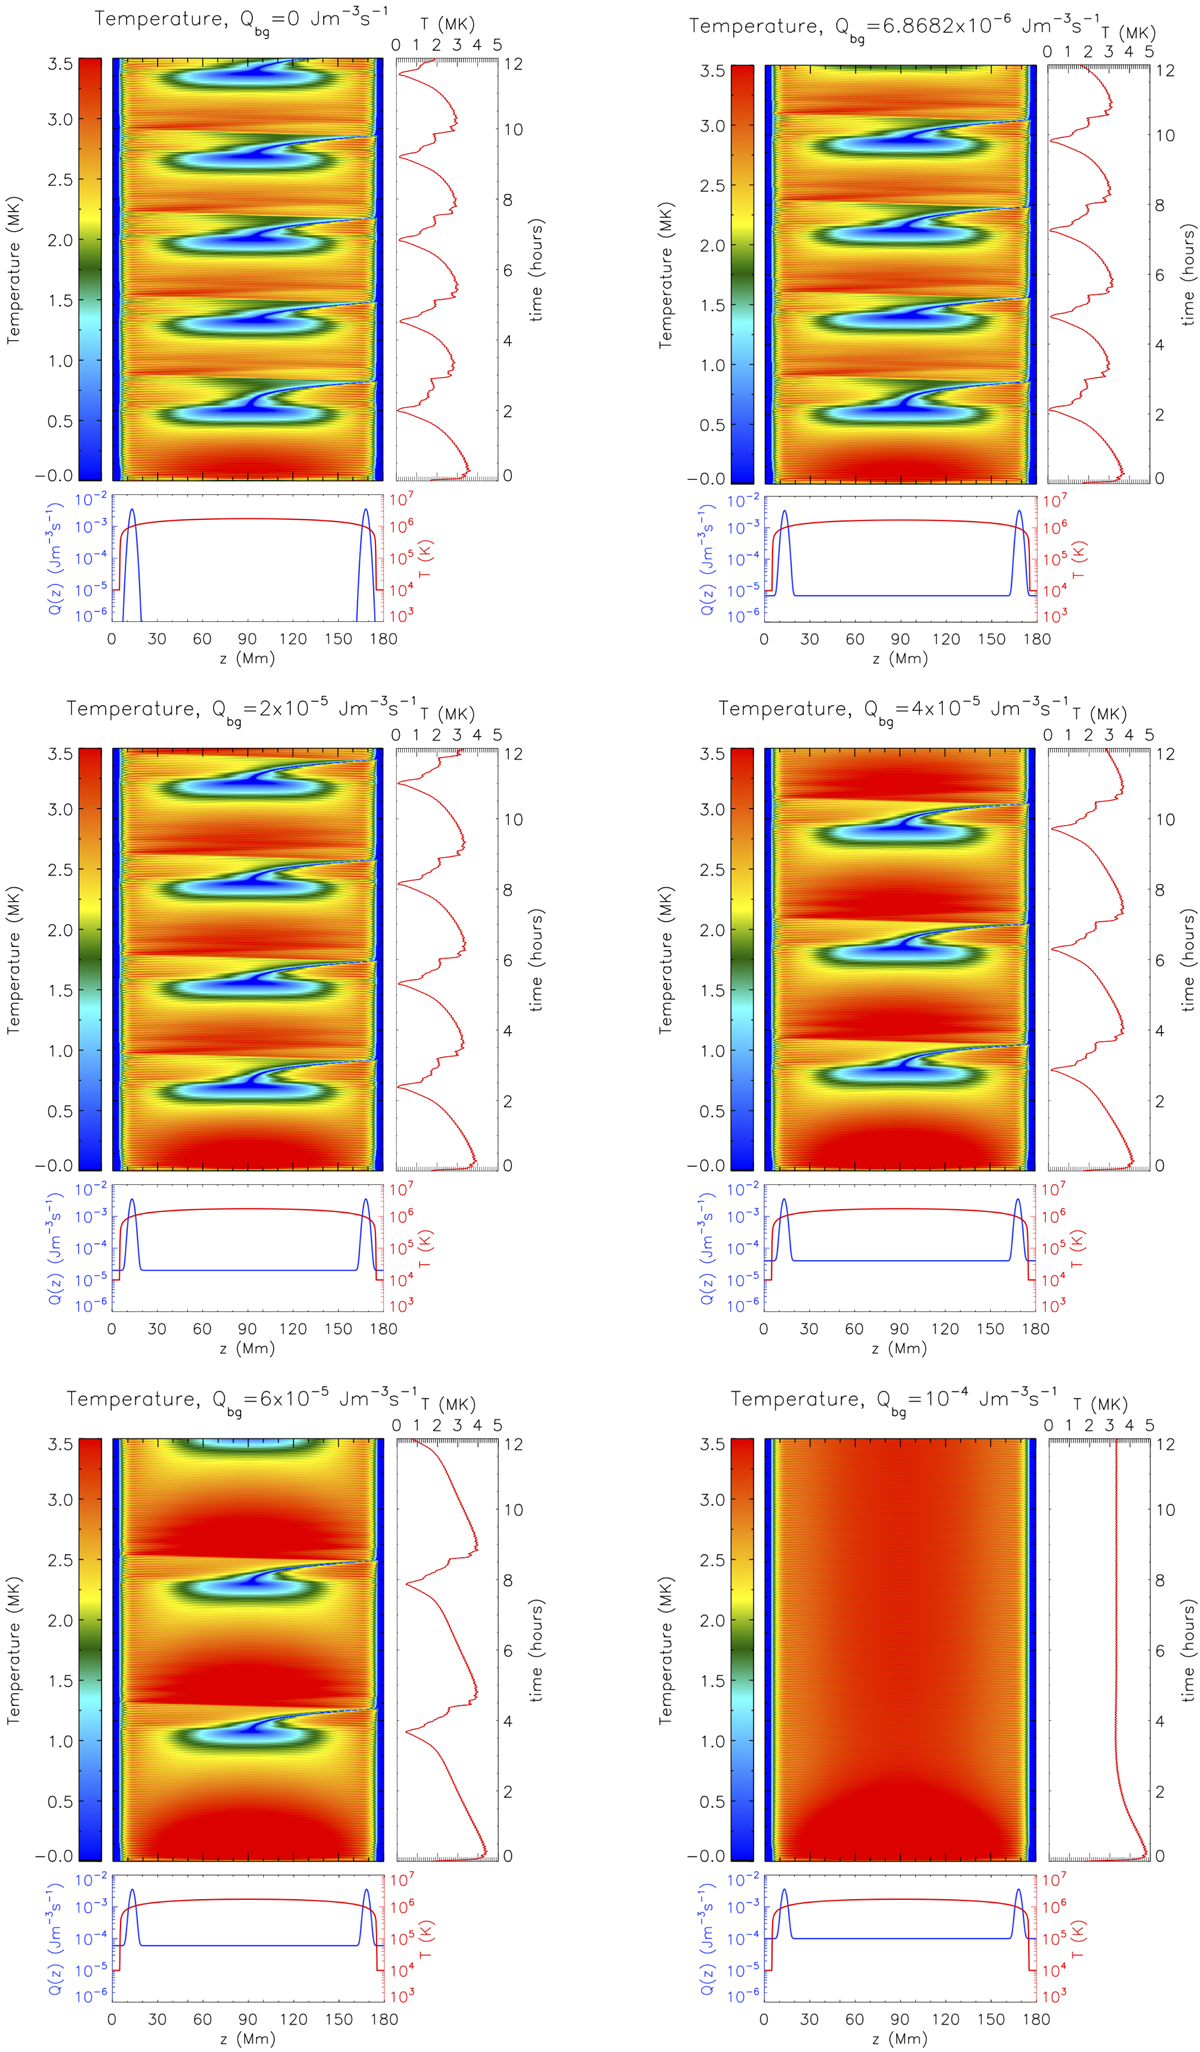
Effect of the background heating on TNE cycles. LareJ results for time dependent footpoint heating. The 2D plots show the time evolution of the temperature as a function of position along the loop. The various panels represent different values of background heating (Qbg). On the right of the 2D plots, we display the evolution of the coronal averaged temperature (computed by spatially averaging over the uppermost 25% of the loop). At the bottom of the 2D plots, we show the time averaged footpoint heating profile (blue line, left-hand axis) imposed on top of the temperature initial condition (red line, right-hand axis).
Current usage metrics show cumulative count of Article Views (full-text article views including HTML views, PDF and ePub downloads, according to the available data) and Abstracts Views on Vision4Press platform.
Data correspond to usage on the plateform after 2015. The current usage metrics is available 48-96 hours after online publication and is updated daily on week days.
Initial download of the metrics may take a while.