Free Access
Fig. 7.
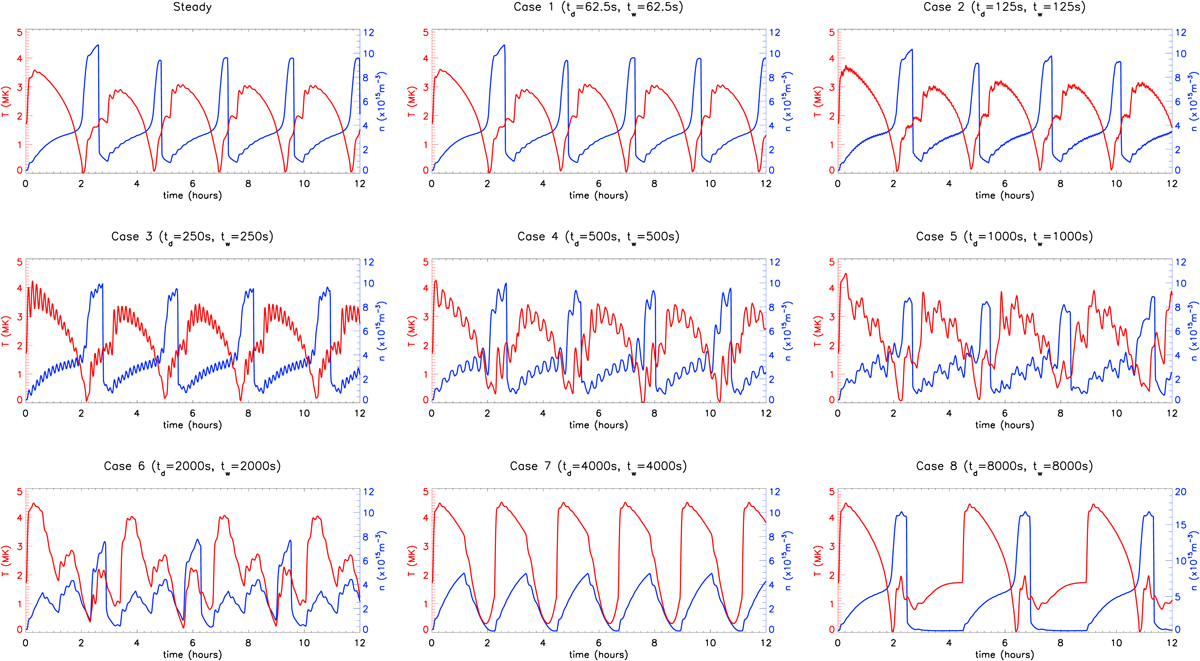
Effect of heating timescales on TNE cycles. LareJ results for time dependent footpoint heating Cases 1–8 together with the steady footpoint heating result. The panels show the time evolution of the coronal averaged temperature (red line, left hand axis) and density (blue line, right hand axis).
Current usage metrics show cumulative count of Article Views (full-text article views including HTML views, PDF and ePub downloads, according to the available data) and Abstracts Views on Vision4Press platform.
Data correspond to usage on the plateform after 2015. The current usage metrics is available 48-96 hours after online publication and is updated daily on week days.
Initial download of the metrics may take a while.