Fig. 4.
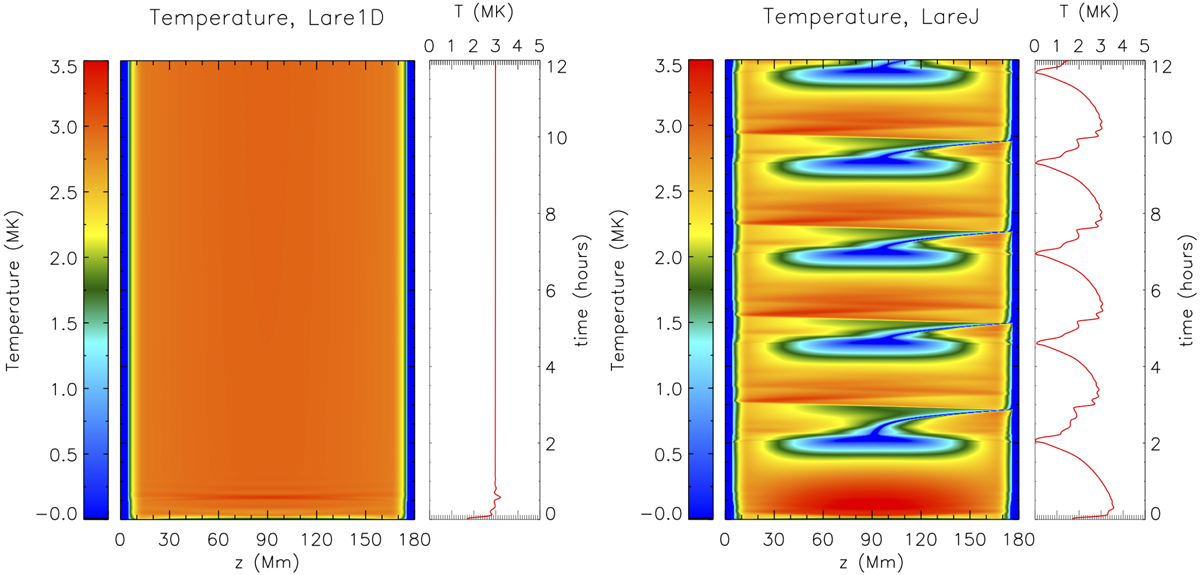
Effect of obtaining the correct evaporative response on TNE cycles. Results for steady footpoint heating. The panels show the time evolution of the temperature as a function of position along the loop obtained in two different simulations, each run with the same spatial resolution of 500 grid points along the length of the loop (coarse resolution – 360 km). Left and right-hand panels: Lare1D and LareJ (Lare1D with the UTR jump condition method) solutions, respectively. On the right of the 2D plots, we display the evolution of the coronal averaged temperature (computed by spatially averaging over the uppermost 25% of the loop).
Current usage metrics show cumulative count of Article Views (full-text article views including HTML views, PDF and ePub downloads, according to the available data) and Abstracts Views on Vision4Press platform.
Data correspond to usage on the plateform after 2015. The current usage metrics is available 48-96 hours after online publication and is updated daily on week days.
Initial download of the metrics may take a while.