Fig. 2.
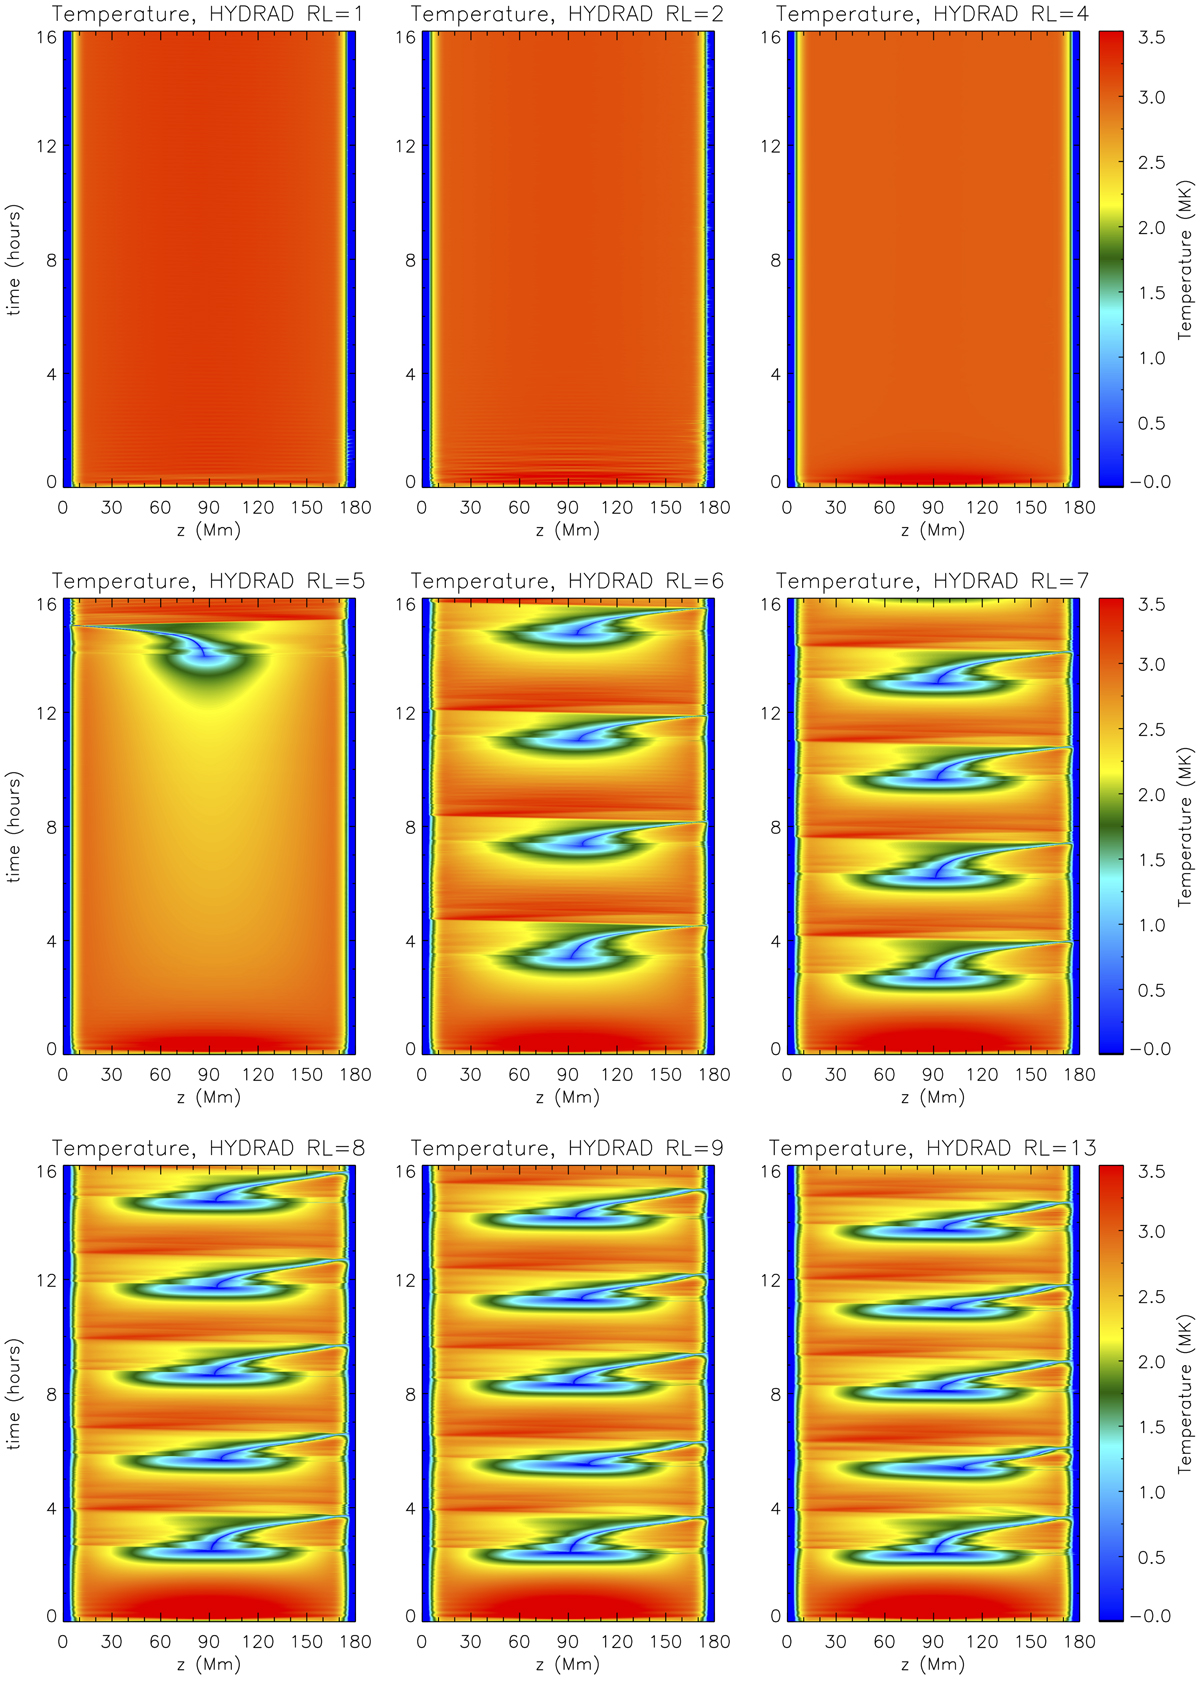
Influence of numerical resolution on the loop temperature and TNE cycle evolution for steady footpoint heating using HYDRAD simulations. Each plot shows the spatial dependence of temperature (horizontal axis) and the temporal evolution (vertical axis). The various panels represent different values of RL, as indicated above the panel.
Current usage metrics show cumulative count of Article Views (full-text article views including HTML views, PDF and ePub downloads, according to the available data) and Abstracts Views on Vision4Press platform.
Data correspond to usage on the plateform after 2015. The current usage metrics is available 48-96 hours after online publication and is updated daily on week days.
Initial download of the metrics may take a while.