Fig. 3.
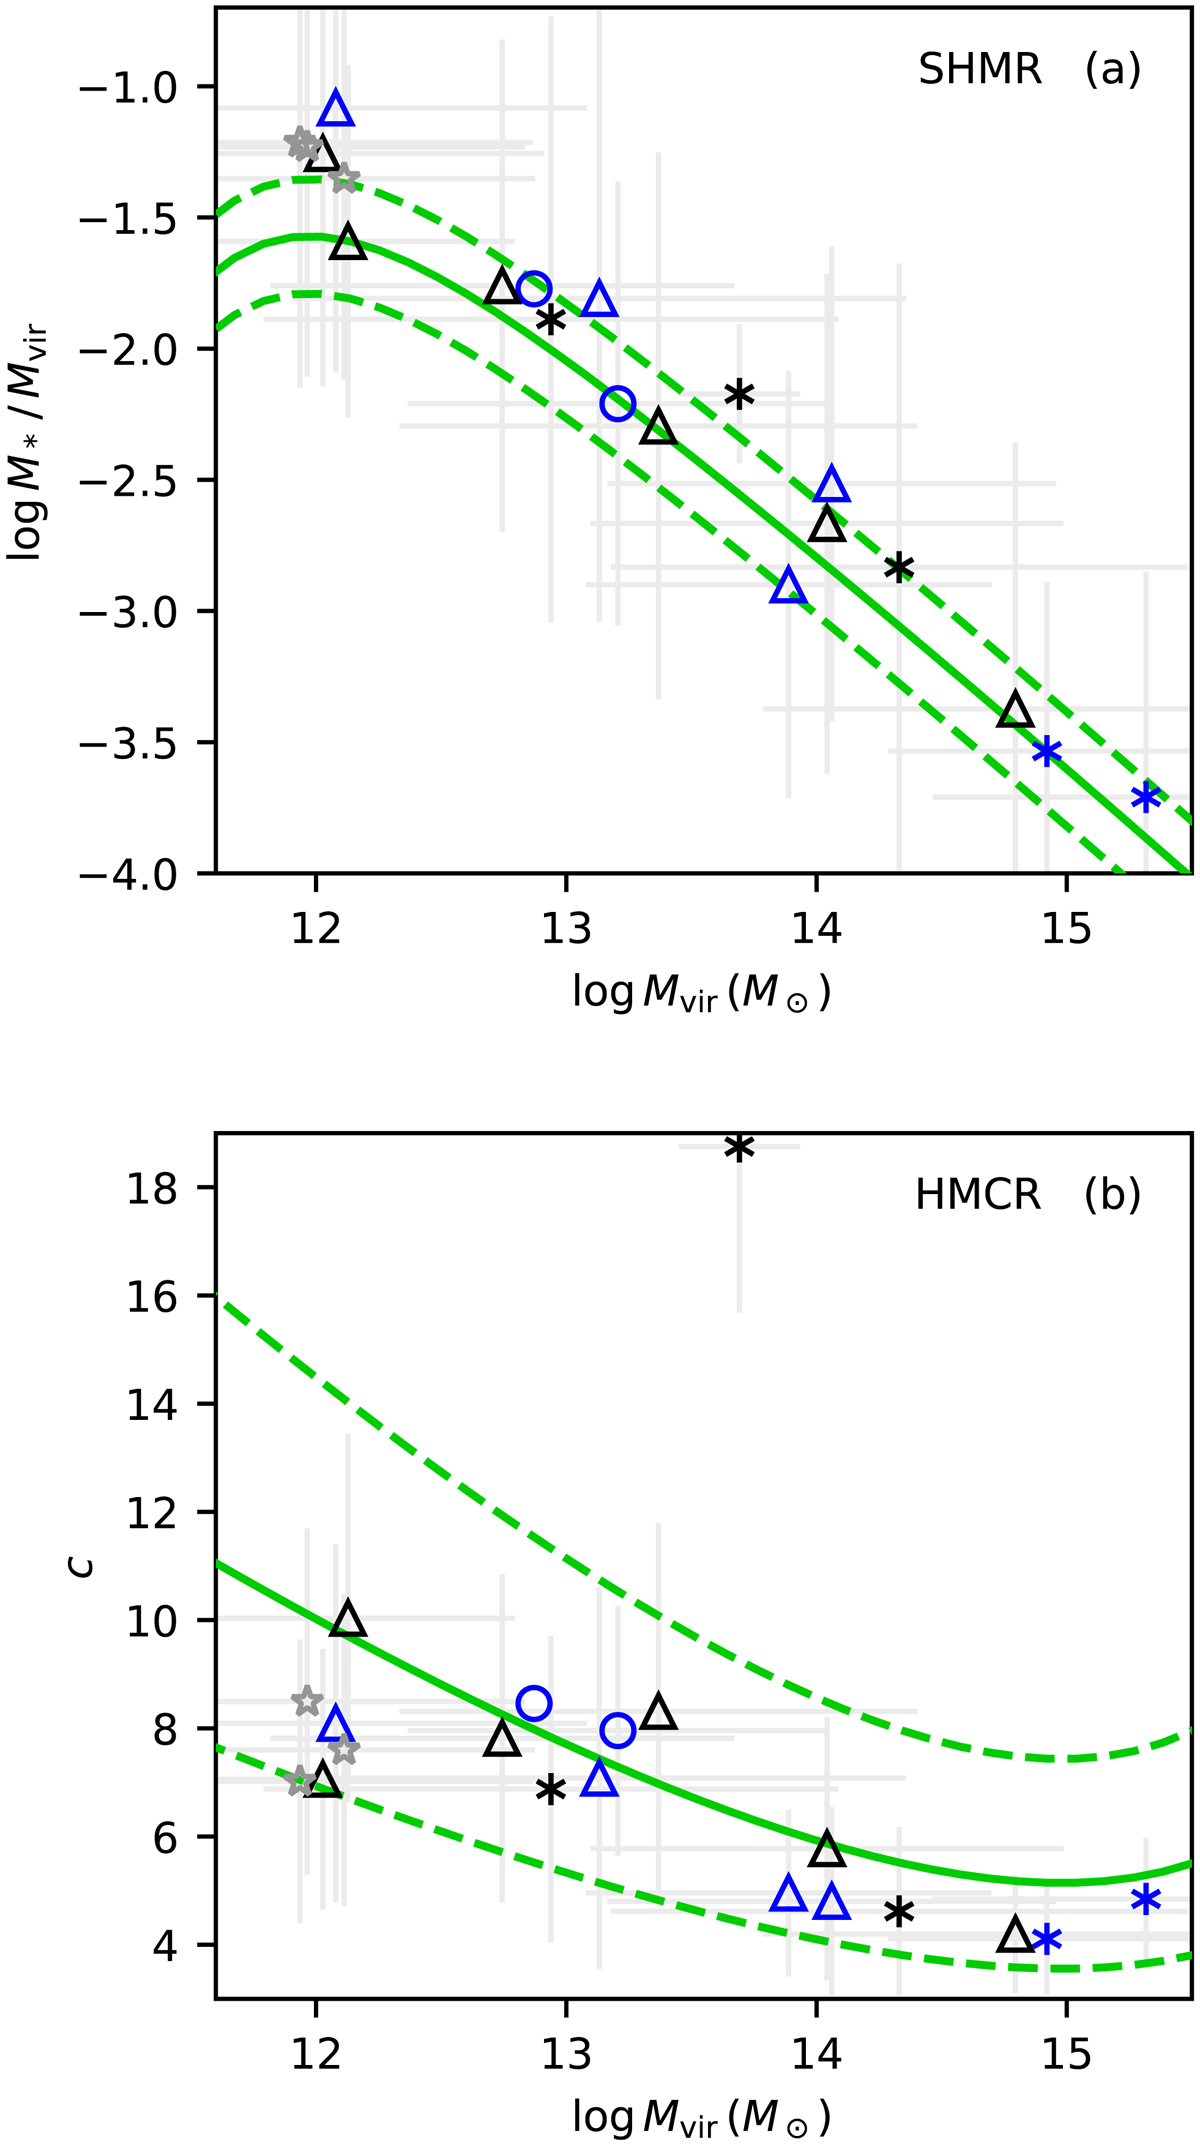
Panel a: stellar-to-halo mass relation. Symbols: recovered relation between the halo mass Mvir and the baryonic fraction in the halo M*/Mvir. Black symbols indicate real galaxies distinguished by environment (circles: field, triangles: group, asterisk: cluster). Blue symbols indicate the real galaxies dominating their environment clearly. Gray open stars indicate the galaxies R17x,y,z from a ΛCDM simulation. We show the parameters found for the anisotropy profile providing the best agreement with the GC data. The full green line indicates the theoretical SHMR found by Behroozi et al. (2013) based on the abundance matching technique. The dashed green lines denote the 1σ scatter region. The two real galaxies in the top left corner are NGC 1023 and NGC 4494. All individual galaxies agree with the prediction within the error bars but the reconstructed SHMR is offset. The collective offset does not seem to be substantially smaller for the dominant galaxies. Panel b: halo mass-concentration relation. The green lines indicate the theoretical HMCR by Diemer & Kravtsov (2015). The most outlying galaxy is NGC 4486. Again, the individual galaxies agree with the prediction but they are collectively offset from it, including the dominant galaxies.
Current usage metrics show cumulative count of Article Views (full-text article views including HTML views, PDF and ePub downloads, according to the available data) and Abstracts Views on Vision4Press platform.
Data correspond to usage on the plateform after 2015. The current usage metrics is available 48-96 hours after online publication and is updated daily on week days.
Initial download of the metrics may take a while.