Free Access
Fig. 5.
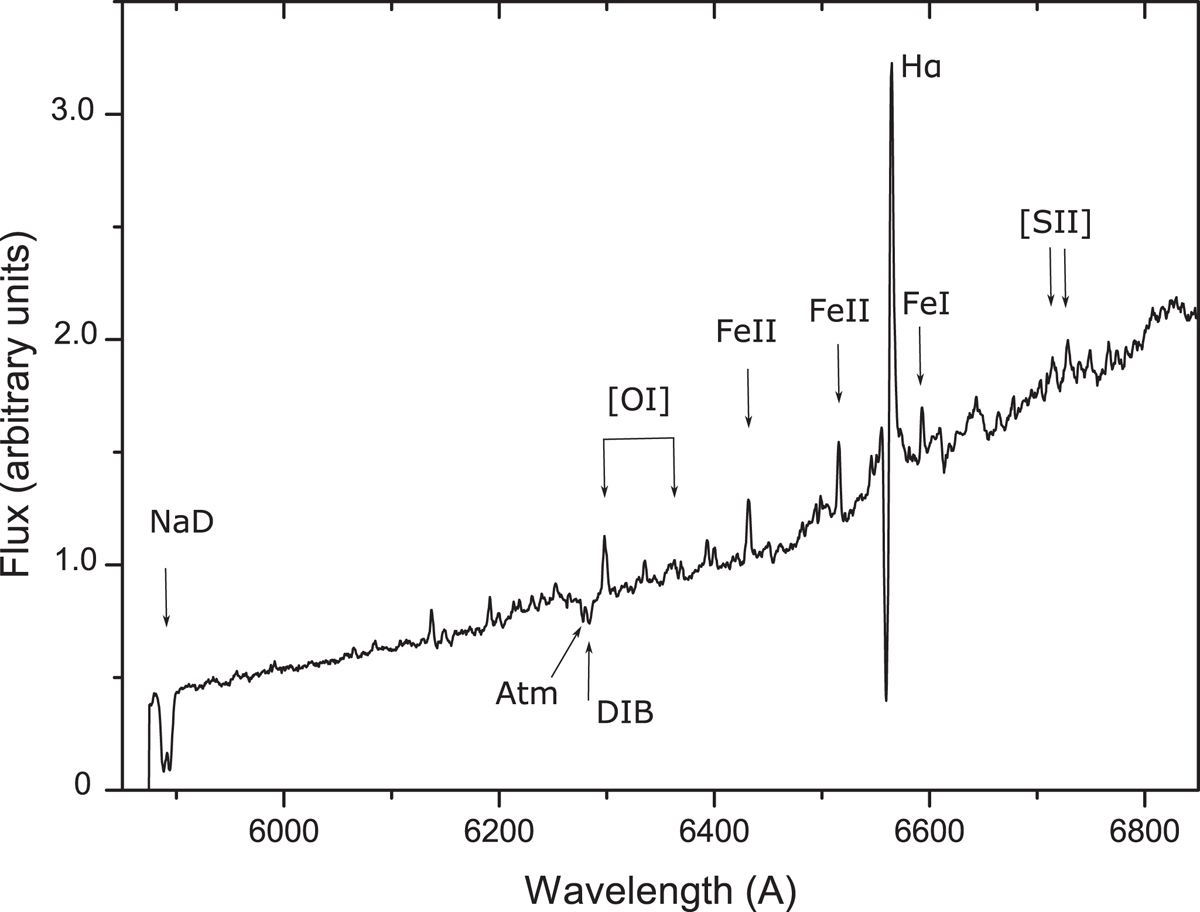
Red part of V1318 Cyg spectrum with better dispersion. The spectrum was obtained with the 2.6 m telescope. P Cyg profile of Hα line and strong NaD absorptions are prominent. Several other features, including forbidden lines, are also identified. A part of this spectrum is shown in more detail in Fig. 7.
Current usage metrics show cumulative count of Article Views (full-text article views including HTML views, PDF and ePub downloads, according to the available data) and Abstracts Views on Vision4Press platform.
Data correspond to usage on the plateform after 2015. The current usage metrics is available 48-96 hours after online publication and is updated daily on week days.
Initial download of the metrics may take a while.