Fig. 3.
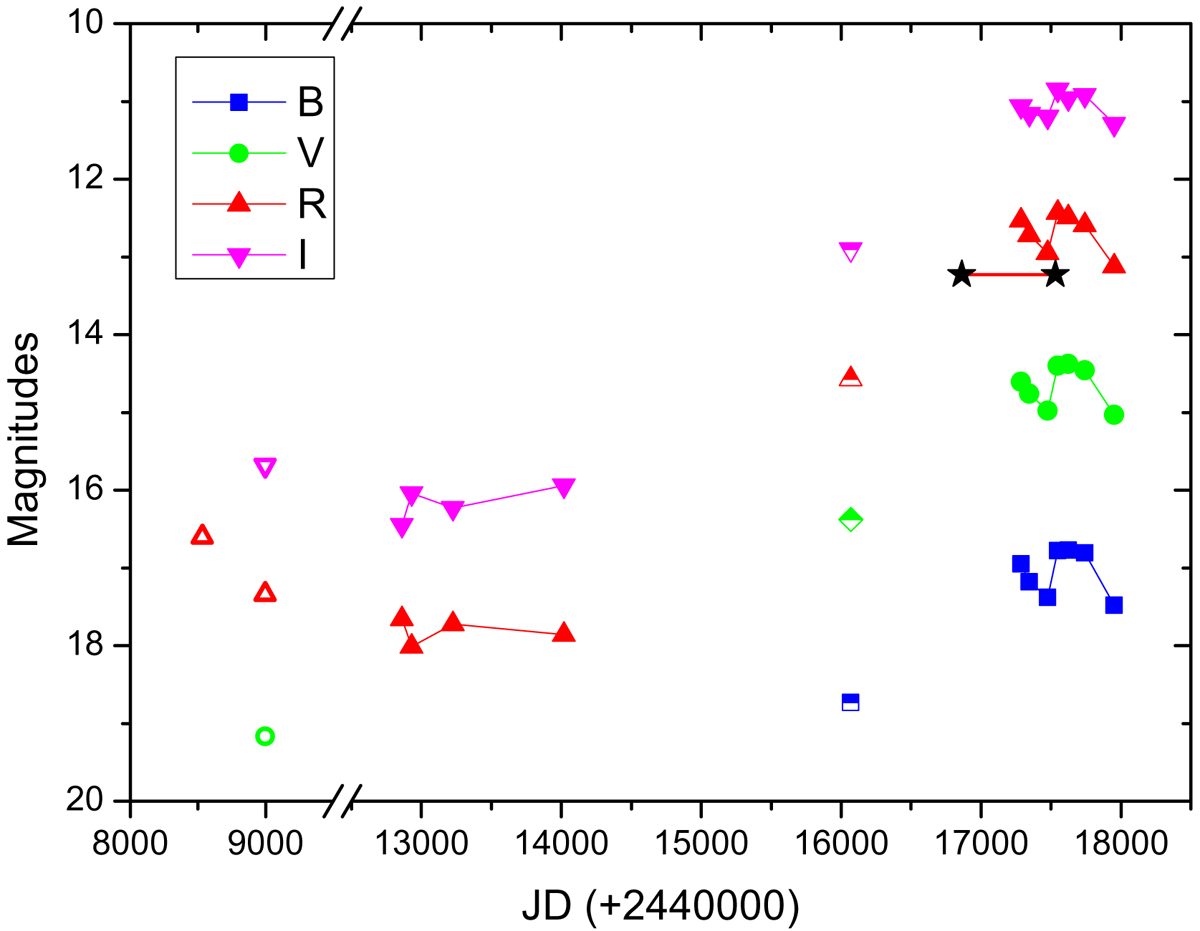
BVRI light curve of V1318 Cyg S for the period of 1991–2017. Filled symbols show our measurements for IPHAS and Byurakan images; open symbols show data of Aspin et al. (1994) and Hillenbrand et al. (1995); half-open symbols show mean estimates for the four-year period of time from PanSTARRS survey (see text); and the line bounded by asterisks shows the level in G magnitude and time period of observations from Gaia DR2.
Current usage metrics show cumulative count of Article Views (full-text article views including HTML views, PDF and ePub downloads, according to the available data) and Abstracts Views on Vision4Press platform.
Data correspond to usage on the plateform after 2015. The current usage metrics is available 48-96 hours after online publication and is updated daily on week days.
Initial download of the metrics may take a while.