Fig. 4
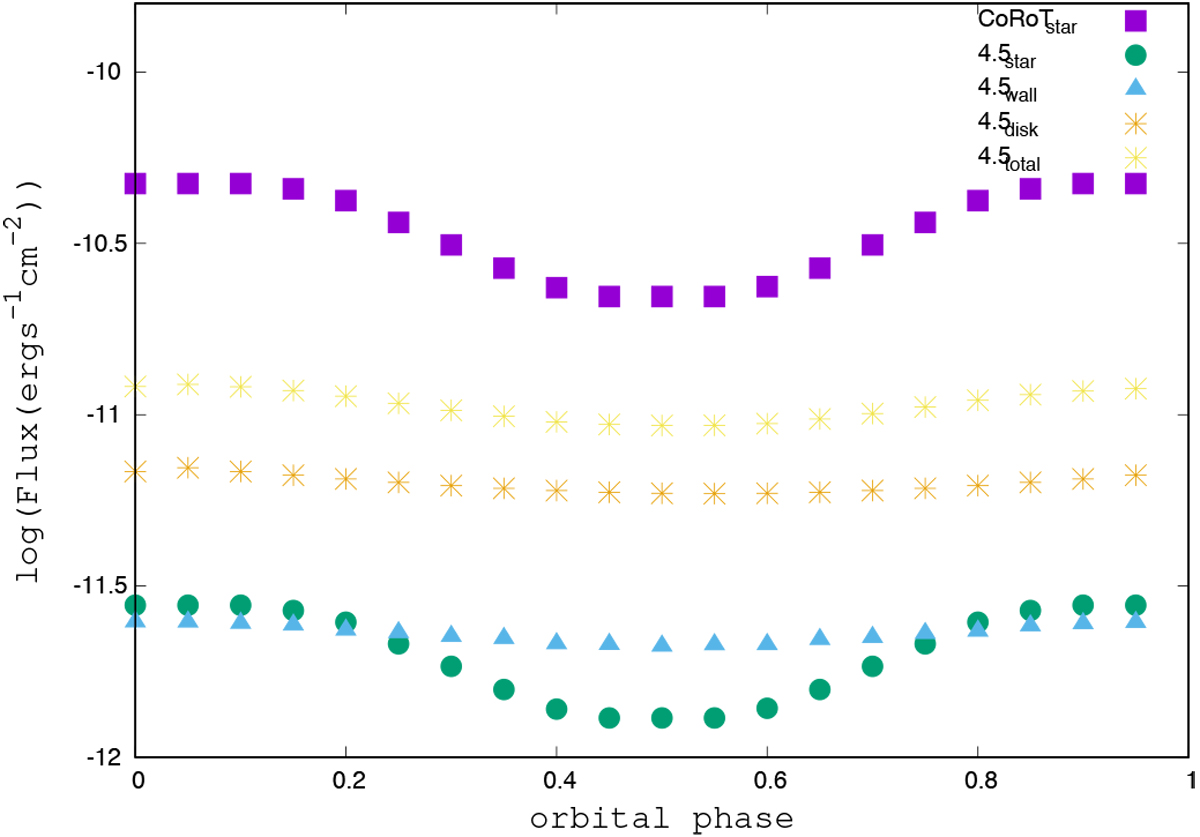
Flux contributions in the optical and the IR for Mon-660 at i = 77°. The modeled CoRoT and 4.5 μm fluxes coming from the star are represented as filled squares and filled circles, respectively. The 4.5 μm fluxes coming from the wall and the disk are plotted with solid triangles and asterisks, respectively. The light asterisks represent the total modeled flux.
Current usage metrics show cumulative count of Article Views (full-text article views including HTML views, PDF and ePub downloads, according to the available data) and Abstracts Views on Vision4Press platform.
Data correspond to usage on the plateform after 2015. The current usage metrics is available 48-96 hours after online publication and is updated daily on week days.
Initial download of the metrics may take a while.