Fig. 3
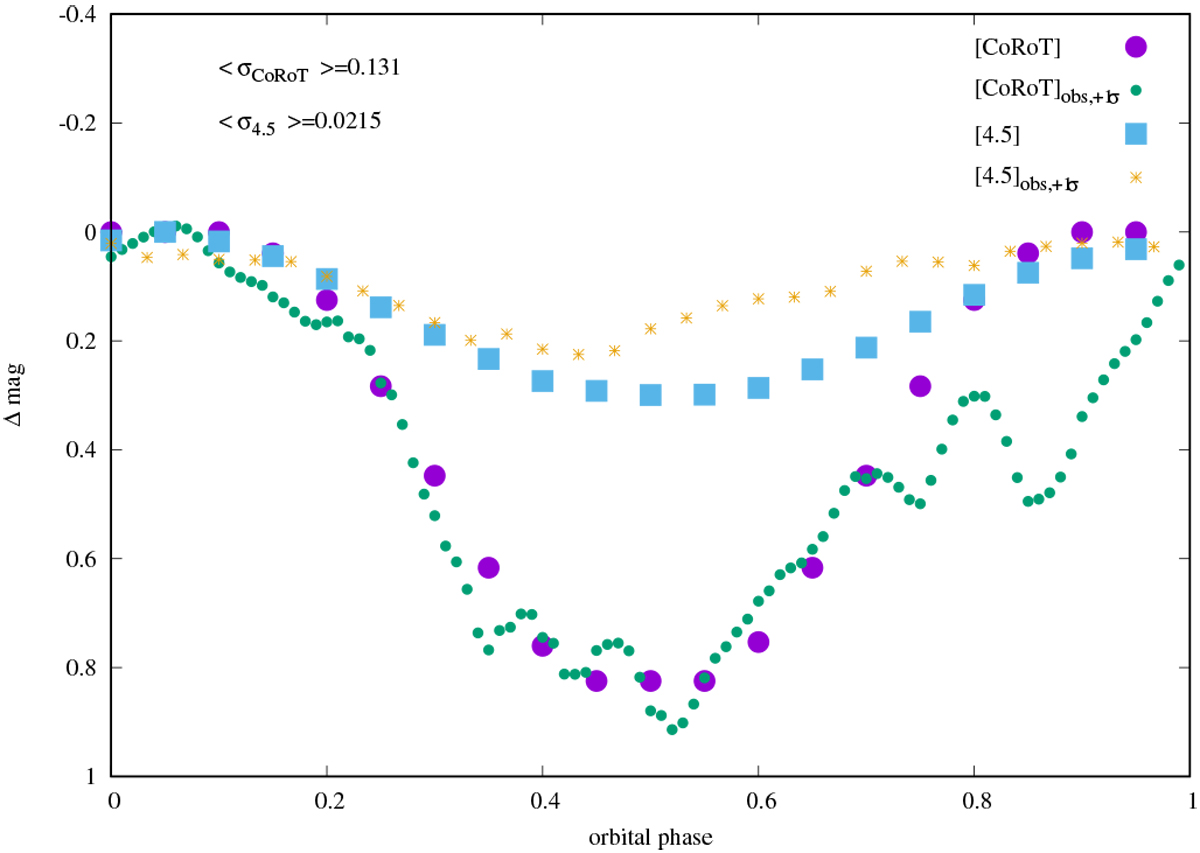
Modeled optical and 4.5 μm lightcurves for Mon-660 at i = 77°. The modeled CoRoT lightcurve is represented by filled circles, and the modeled Spitzer photometric magnitudes at 4.5 μm are plotted as solid squares. For comparison the observed + 1σ CoRoT (points) and the + 1σ Spitzer 4.5 μm (asterixs) lightcurves are presented. We use all the cycles presented in McGinnis et al. (2015) to calculate the observed curves. At the upper left corner, we show the value for the mean standard deviation for the CoRoT and Spitzer data.
Current usage metrics show cumulative count of Article Views (full-text article views including HTML views, PDF and ePub downloads, according to the available data) and Abstracts Views on Vision4Press platform.
Data correspond to usage on the plateform after 2015. The current usage metrics is available 48-96 hours after online publication and is updated daily on week days.
Initial download of the metrics may take a while.