Fig. A.4.
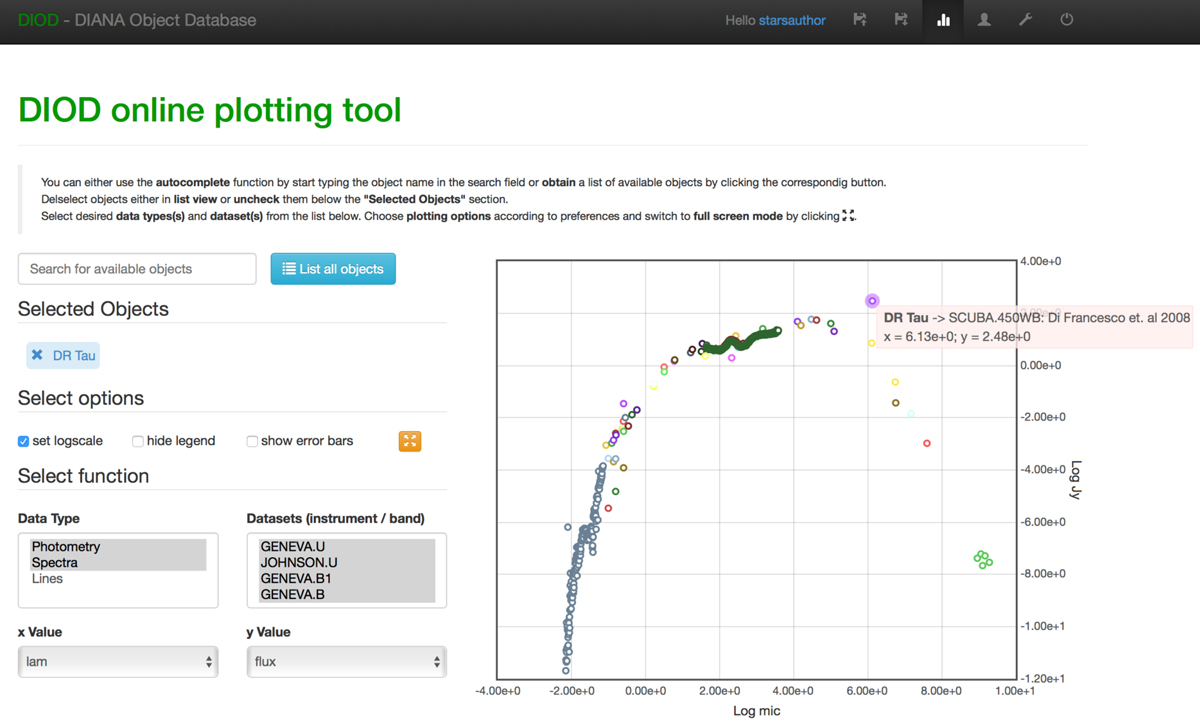
The basic plotting and overview functionality of DIOD; when desired datasets are selected, they can be plotting through a number of preselected display modes. Color encoding of the data points in the plot corresponds to different datasets or objects. When the mouse pointer is over a specific data point, a popup window displays relevant information on its provenance.
Current usage metrics show cumulative count of Article Views (full-text article views including HTML views, PDF and ePub downloads, according to the available data) and Abstracts Views on Vision4Press platform.
Data correspond to usage on the plateform after 2015. The current usage metrics is available 48-96 hours after online publication and is updated daily on week days.
Initial download of the metrics may take a while.