Fig. 3.
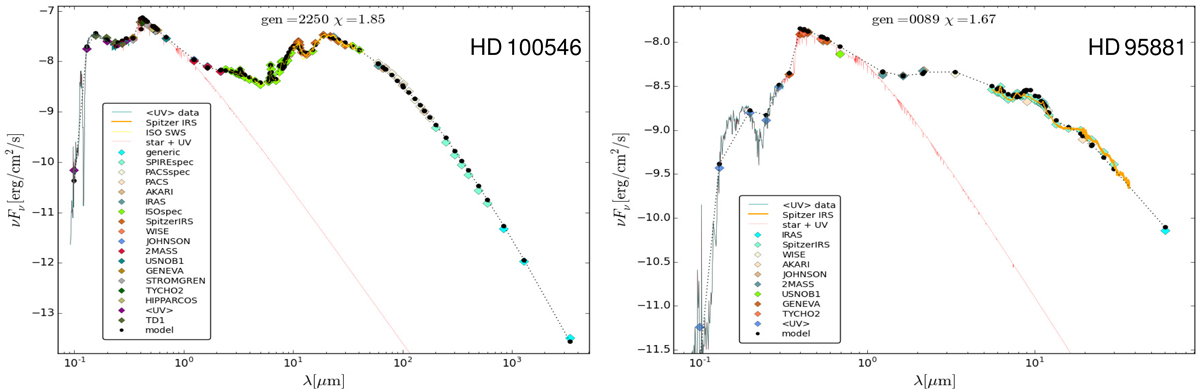
Examples of results from the SED-fits included in the database. The red line is the assumed photospheric + UV spectrum of the star. The black dots are the fluxes computed by MCFOST, at all wavelength points where we could find observations. The other colored dots and lines and observational data as indicated in the embedded legends.
Current usage metrics show cumulative count of Article Views (full-text article views including HTML views, PDF and ePub downloads, according to the available data) and Abstracts Views on Vision4Press platform.
Data correspond to usage on the plateform after 2015. The current usage metrics is available 48-96 hours after online publication and is updated daily on week days.
Initial download of the metrics may take a while.