Fig. 1.
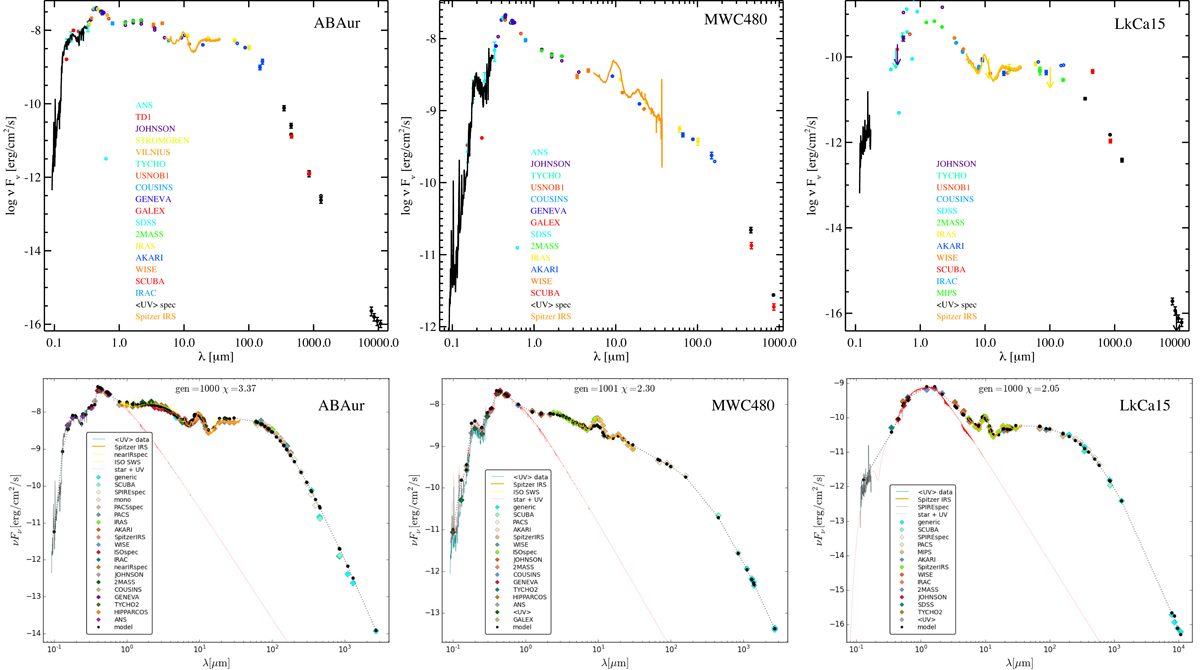
Example of “raw” collected data represented as SED diagrams for three sources (top row). Data for AB Aur (left panel) delineate well the stellar and disk emission and show little scatter. The same is true for MWC 480 (mid panel), the Akari data points however show some deviation when compared to the Spitzer/IRS spectra. For a weaker source like LkCa 15 (right panel), the scatter is significant due to certain, not well pointed observations, and therefore the SED is not well defined. SED plots for all sources are given as online data in Fig. C.1. Lower row presents the actual modeled data for the three sources, after being hand-selected for consistency.
Current usage metrics show cumulative count of Article Views (full-text article views including HTML views, PDF and ePub downloads, according to the available data) and Abstracts Views on Vision4Press platform.
Data correspond to usage on the plateform after 2015. The current usage metrics is available 48-96 hours after online publication and is updated daily on week days.
Initial download of the metrics may take a while.