Fig. 5.
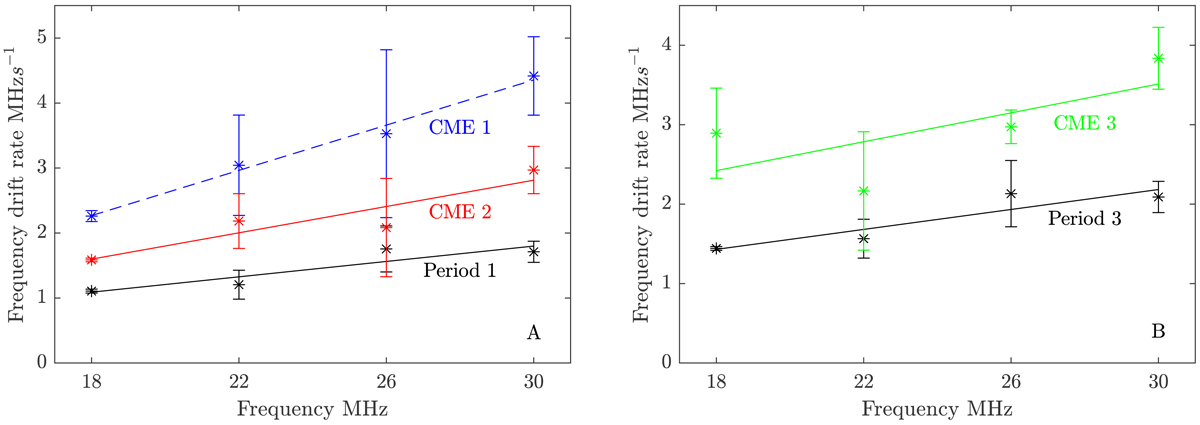
Drift rate dependence on frequency according to the observations of type III and narrow-band type-III-like bursts on June 13, 2014. Panel A: periods 1 and 2, and panel B: periods 3 and 4. In panel A the dashed line linear regression with corresponding observationally measured values (asterisks with error bars) are shown in blue and they are related to the interval 08:00–09:00 UT when CME 1 was detected, and similarly the solid line and corresponding measured values are shown in red for the interval 09:00–10:10 UT, when CME 2 was detected. In panel B again the solid line and corresponding measured values are given in green and they show results for the time interval 12:50 UT–14:55 UT, when CME 3 was detected. In both panels for data and lines in period 1 and period 3, black is used.
Current usage metrics show cumulative count of Article Views (full-text article views including HTML views, PDF and ePub downloads, according to the available data) and Abstracts Views on Vision4Press platform.
Data correspond to usage on the plateform after 2015. The current usage metrics is available 48-96 hours after online publication and is updated daily on week days.
Initial download of the metrics may take a while.