Fig. 4.
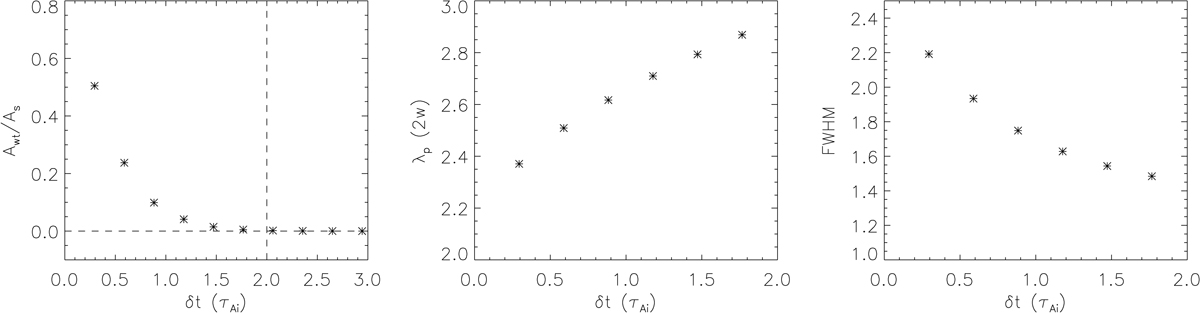
Left panel: amplitude ratio of the fast wave train and slow wave measured at t = 110 plotted against the driver duration in units of the Alfvén transit time across the waveguide. The cutoff above which the fast wave train is no longer considered to be efficiently excited is shown by the vertical dashed line. Middle panel: wavelength of peak spectral amplitude (in units of the waveguide width) of the fast wave train plotted against the driver duration. Right panel: spectral width of the fast wave train signal plotted against the driver duration.
Current usage metrics show cumulative count of Article Views (full-text article views including HTML views, PDF and ePub downloads, according to the available data) and Abstracts Views on Vision4Press platform.
Data correspond to usage on the plateform after 2015. The current usage metrics is available 48-96 hours after online publication and is updated daily on week days.
Initial download of the metrics may take a while.