Fig. 2.
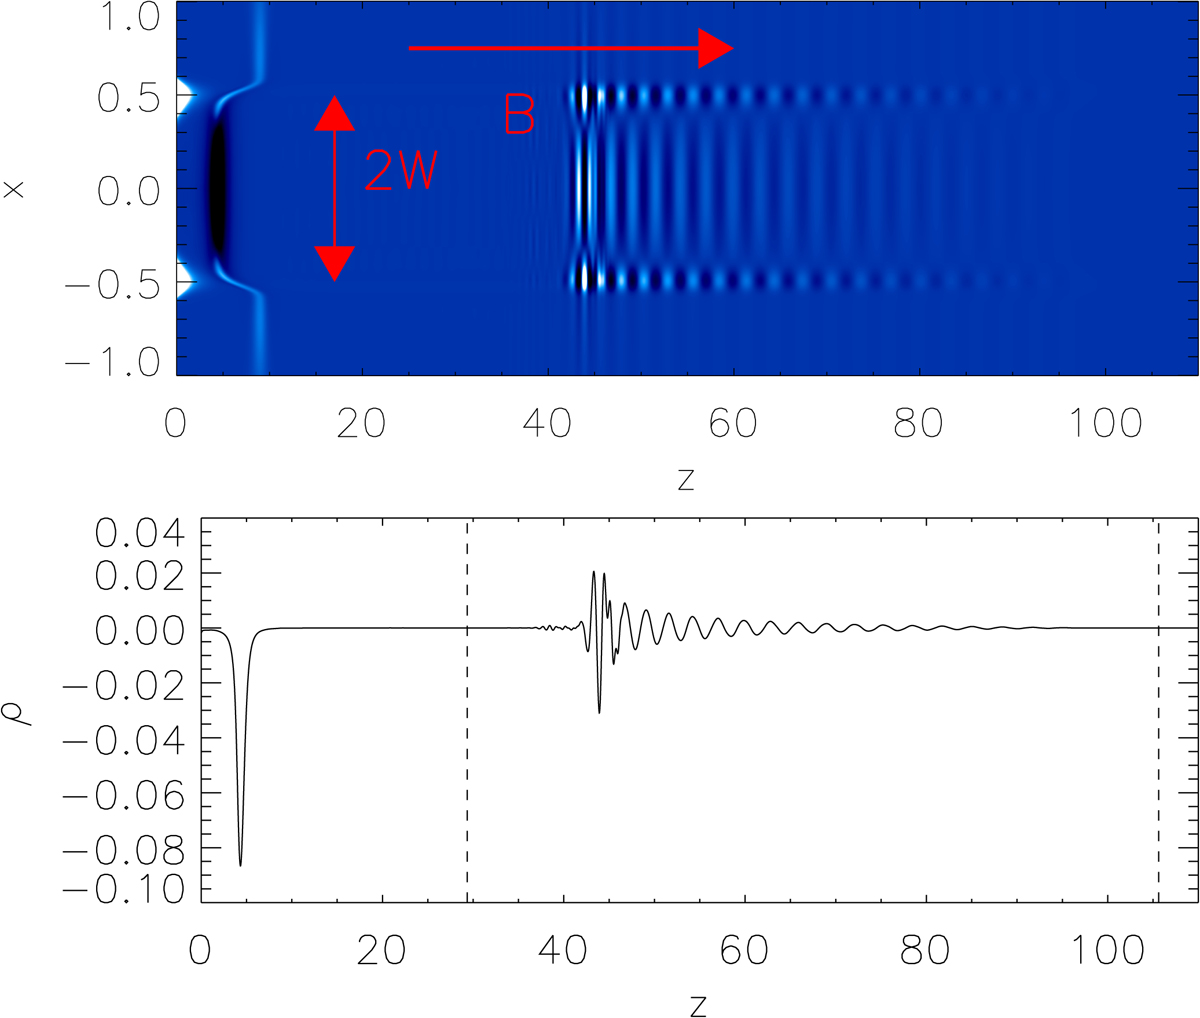
Top panel: perturbation to the equilibrium density at t = 110 from a driver with δt = 0.58 τAi. The slow wave can be seen at z ∼ 10 and the fast wave train between z ∼ 40 and z ∼ 100, both propagating to the right. The waveguide width is indicated by 2w, and the magnetic field direction by B. Bottom panel: pertubation to the equilibrium density measured along the centre of the waveguide (x = 0) from the above simulation output. The region between the dashed vertical lines denotes the section of the signal used for analysis of the fast wave train.
Current usage metrics show cumulative count of Article Views (full-text article views including HTML views, PDF and ePub downloads, according to the available data) and Abstracts Views on Vision4Press platform.
Data correspond to usage on the plateform after 2015. The current usage metrics is available 48-96 hours after online publication and is updated daily on week days.
Initial download of the metrics may take a while.