Fig. I.13
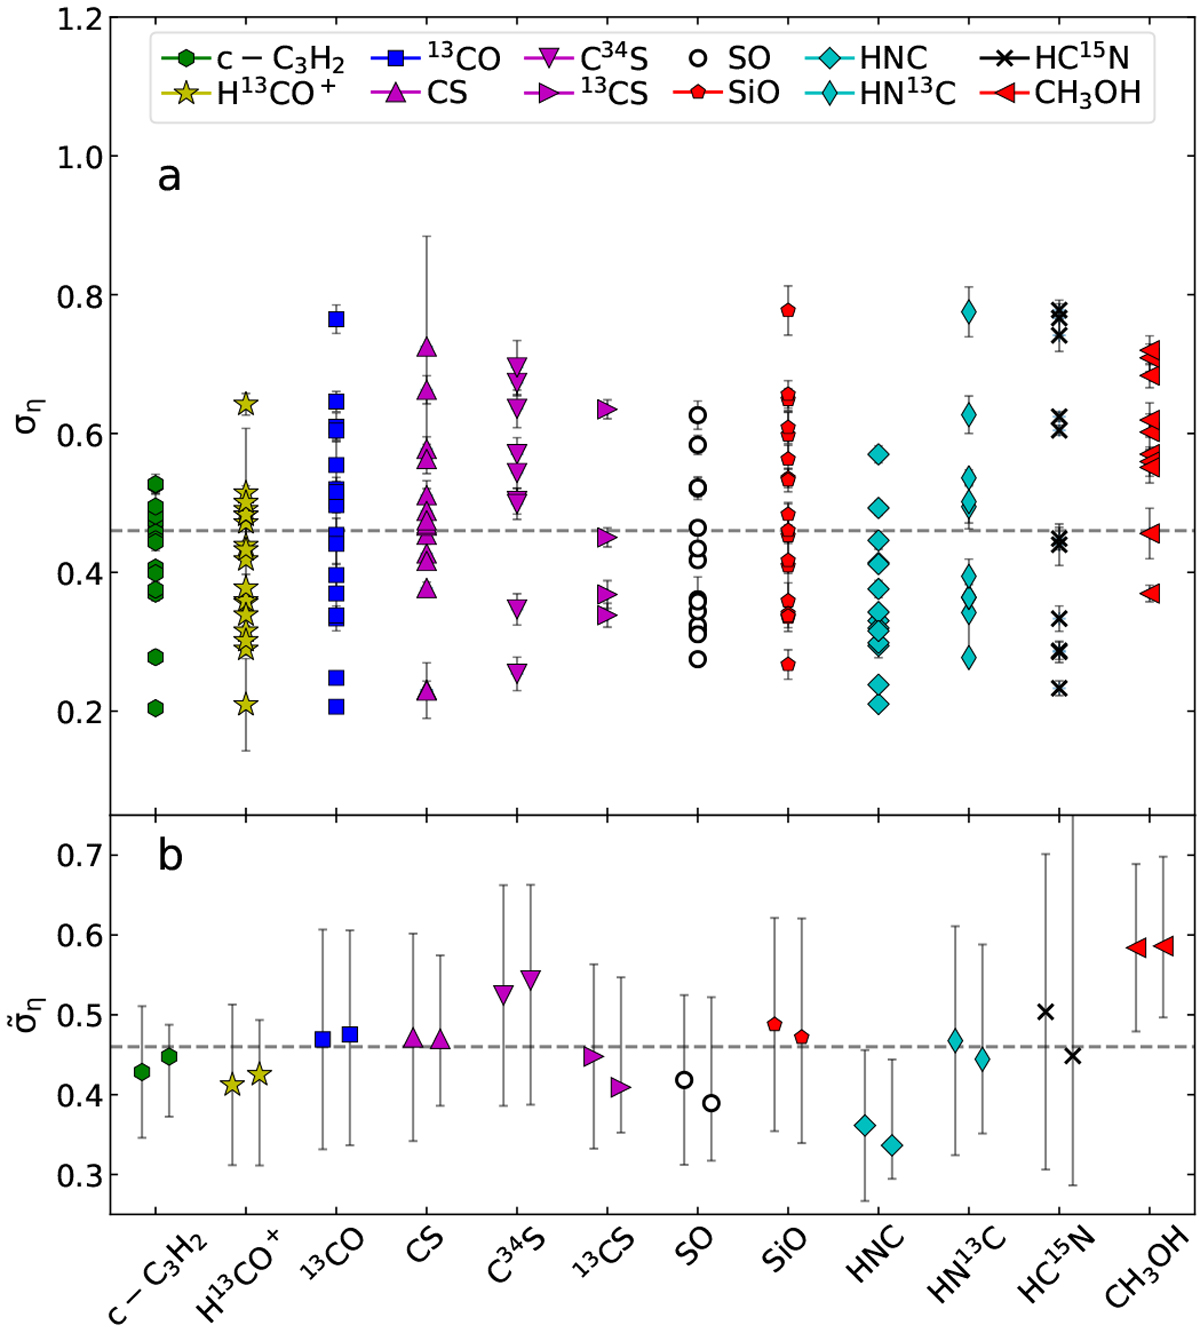
Panel a: widths of the Gaussians fitted to the PDFs of 15 velocity components sorted by molecule. Panel b: mean (left) and median (right) values for each molecule. The uncertainties represent the standard deviation for the mean and the corresponding percentiles for the median. The dashed line marks the mean value for all components (see Fig. I.12).
Current usage metrics show cumulative count of Article Views (full-text article views including HTML views, PDF and ePub downloads, according to the available data) and Abstracts Views on Vision4Press platform.
Data correspond to usage on the plateform after 2015. The current usage metrics is available 48-96 hours after online publication and is updated daily on week days.
Initial download of the metrics may take a while.