Fig. 6
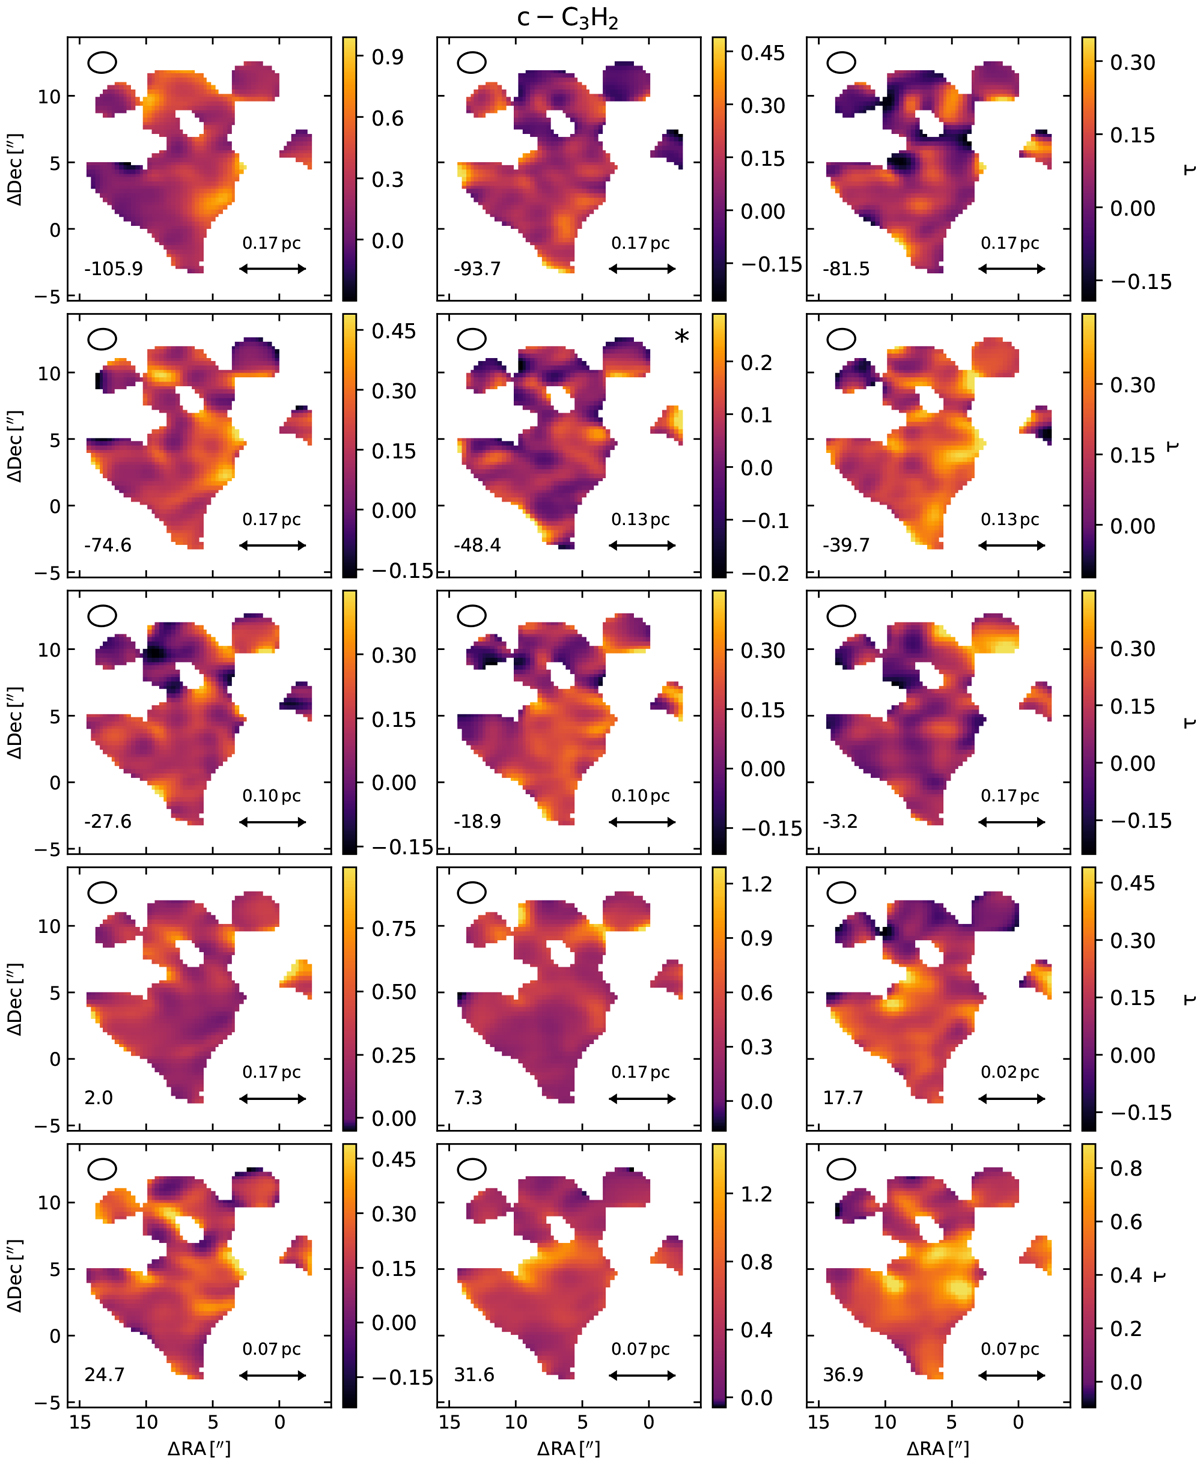
Opacity maps of c-C3H2 21,2 –10,1 for all 15 investigated velocity components. In each panel, the velocity of the channel is given in km s−1 in the bottom left corner, the beam (HPBW) is shown as an ellipse in the upper left corner, and an approximate physical scale for the assumed distance of the cloud (see Table 3) is indicated in the bottom right corner. A star in the upper right corner marks the components with a maximum S/N τ/στ smaller than 5 (see Fig. 7). The equatorial offsets are relative to the phase centre.
Current usage metrics show cumulative count of Article Views (full-text article views including HTML views, PDF and ePub downloads, according to the available data) and Abstracts Views on Vision4Press platform.
Data correspond to usage on the plateform after 2015. The current usage metrics is available 48-96 hours after online publication and is updated daily on week days.
Initial download of the metrics may take a while.