Fig. 5
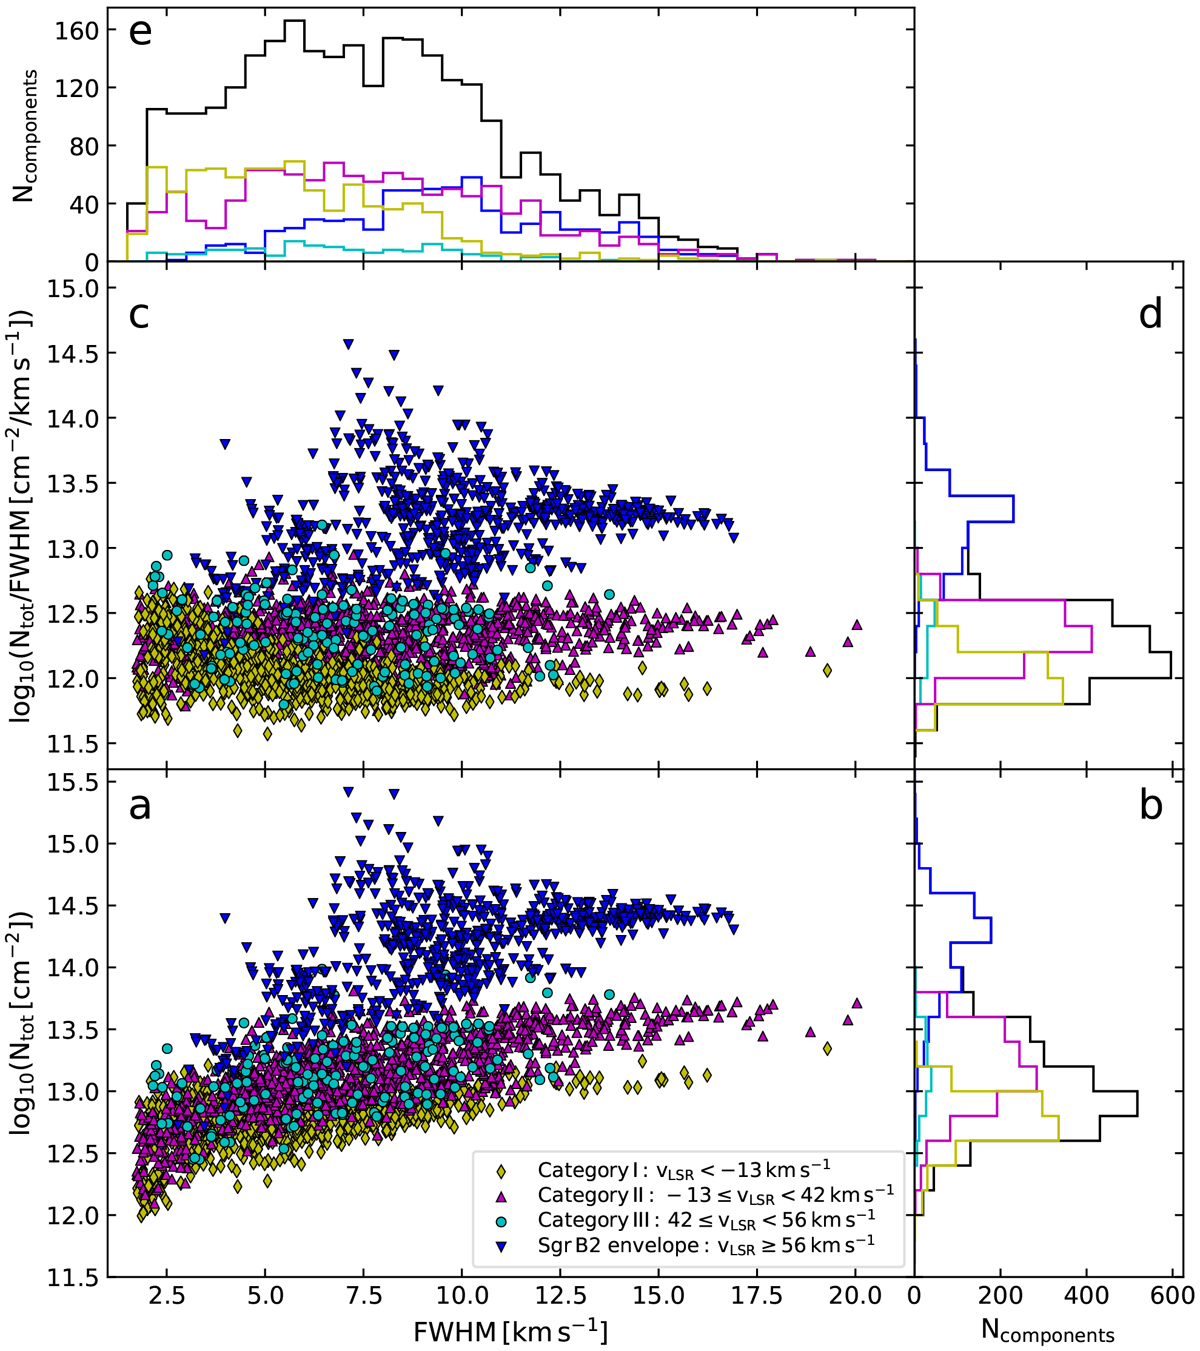
Panel a: distribution of column densities as a function of linewidth. Panel b: number of components as a function of column density. Panel c: distribution of column densities divided by linewidth as a function of linewidth. Panel d: number of components as a function of column density divided by linewidth. Panel e: number of velocity components as a function of linewidth. The bin width is 0.5 km s−1. In all panels the two categories of line-of-sight clouds are coloured in yellow (Category I) and magenta (Category II), the clouds at about 50 km s−1 in cyan (Category III), and the components tracing the diffuse envelope of Sgr B2 in blue. In panels b, d, and e, the black histogram represents the full sample of detected components.
Current usage metrics show cumulative count of Article Views (full-text article views including HTML views, PDF and ePub downloads, according to the available data) and Abstracts Views on Vision4Press platform.
Data correspond to usage on the plateform after 2015. The current usage metrics is available 48-96 hours after online publication and is updated daily on week days.
Initial download of the metrics may take a while.