Open Access
Fig. D.3
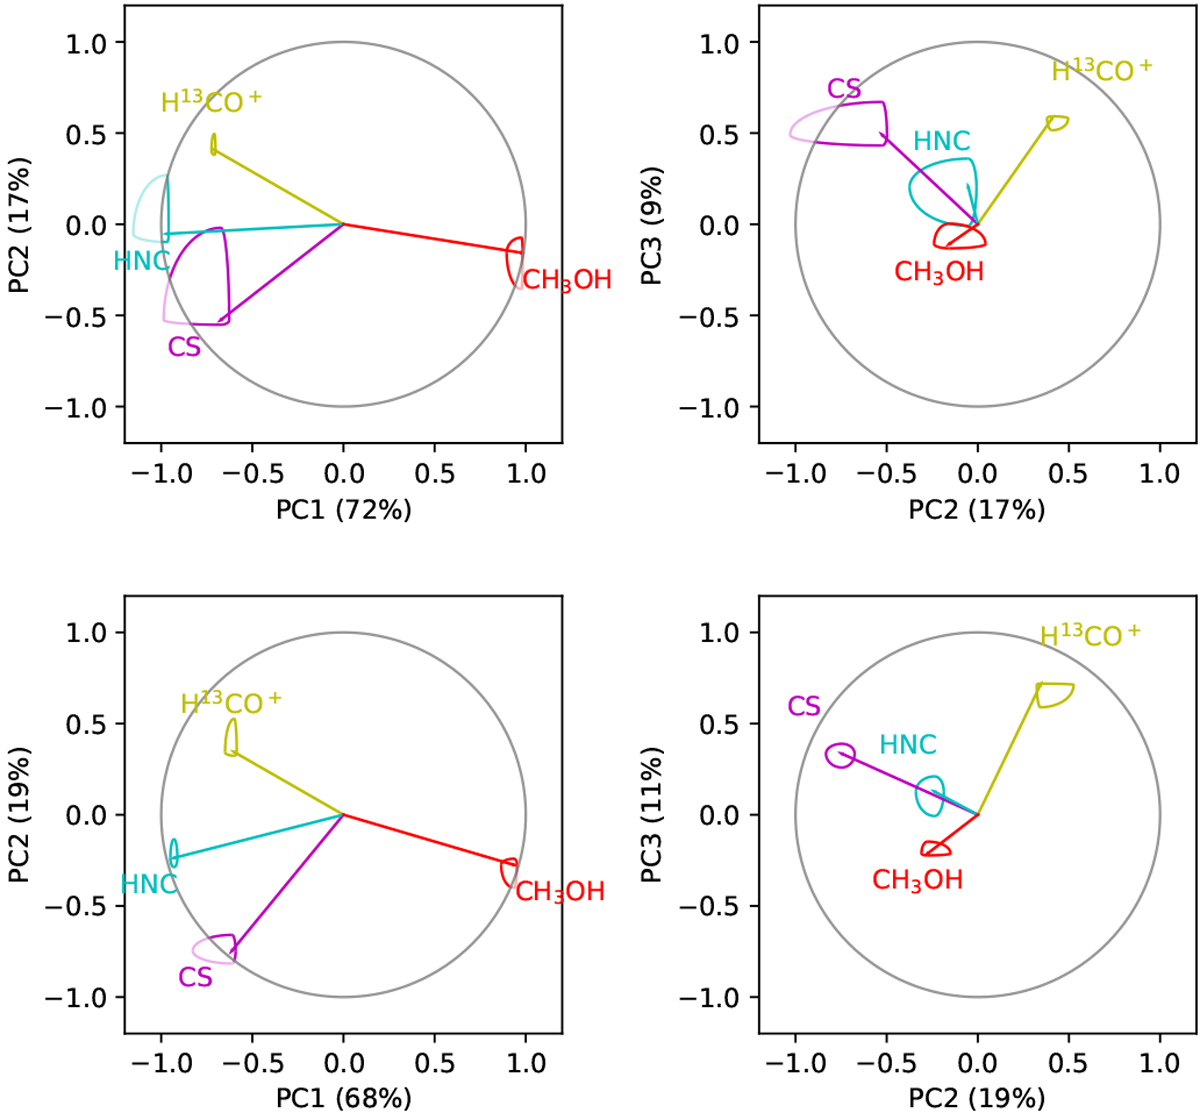
Correlation wheels for PCs at vLSR = 24.7 km s−1 for grid size1 as in Fig. D.1. The first two wheels displayed in the upper panels show the results from the PCA excluding 40 pixels. The wheels in the lower panels result from excluding 80 pixels. The ellipses around the arrow headsshow the uncertainties.
Current usage metrics show cumulative count of Article Views (full-text article views including HTML views, PDF and ePub downloads, according to the available data) and Abstracts Views on Vision4Press platform.
Data correspond to usage on the plateform after 2015. The current usage metrics is available 48-96 hours after online publication and is updated daily on week days.
Initial download of the metrics may take a while.