Open Access
Fig. D.2
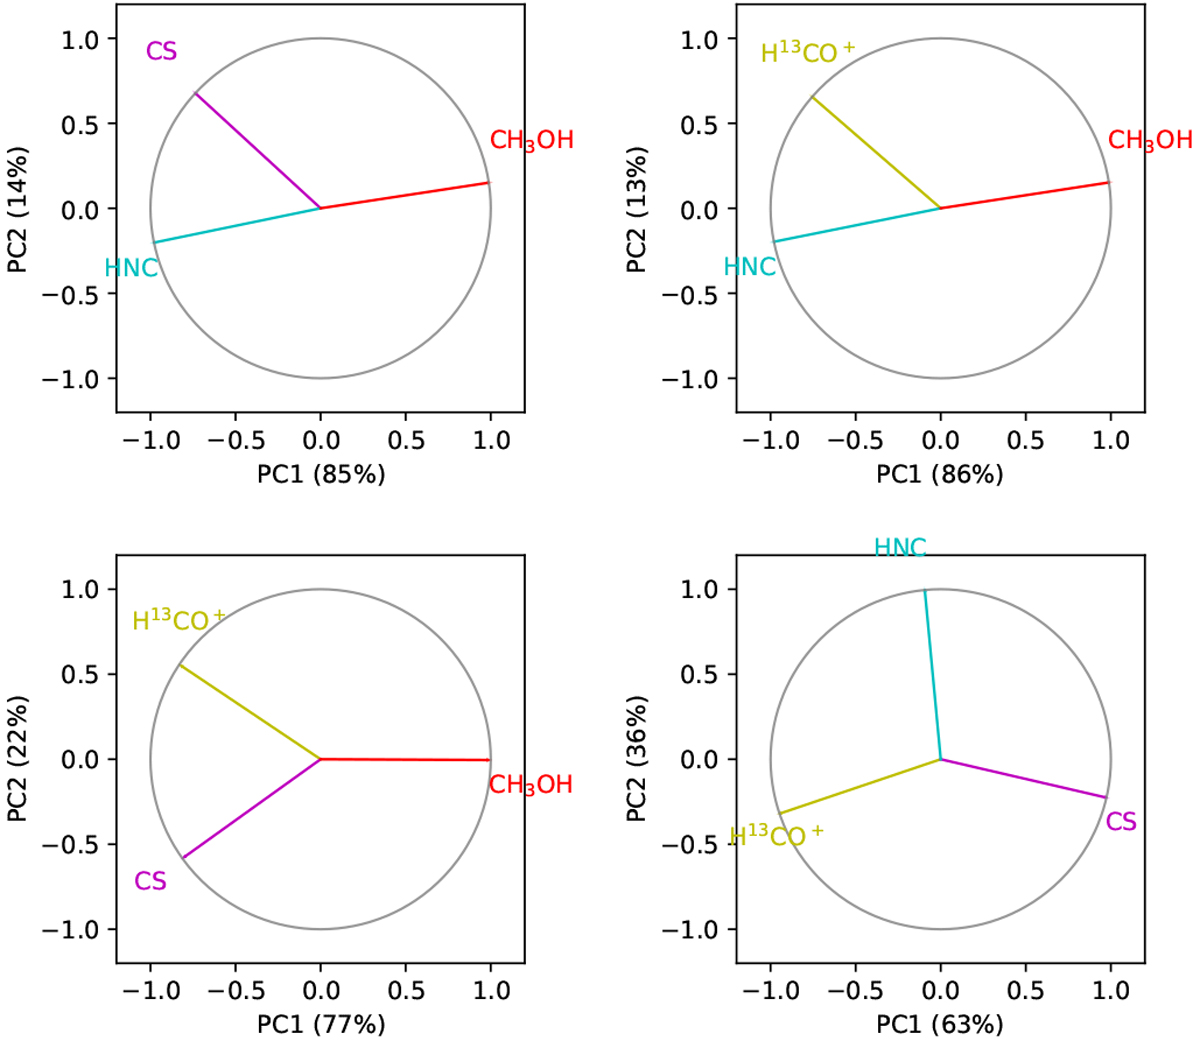
First correlation wheels for the velocity component at vLSR = 24.7 km s−1 for grid size 2. Each panel shows the results of the PCA after removing one of the four molecules used in the middle left panel of Fig. D.1.
Current usage metrics show cumulative count of Article Views (full-text article views including HTML views, PDF and ePub downloads, according to the available data) and Abstracts Views on Vision4Press platform.
Data correspond to usage on the plateform after 2015. The current usage metrics is available 48-96 hours after online publication and is updated daily on week days.
Initial download of the metrics may take a while.