Fig. 3
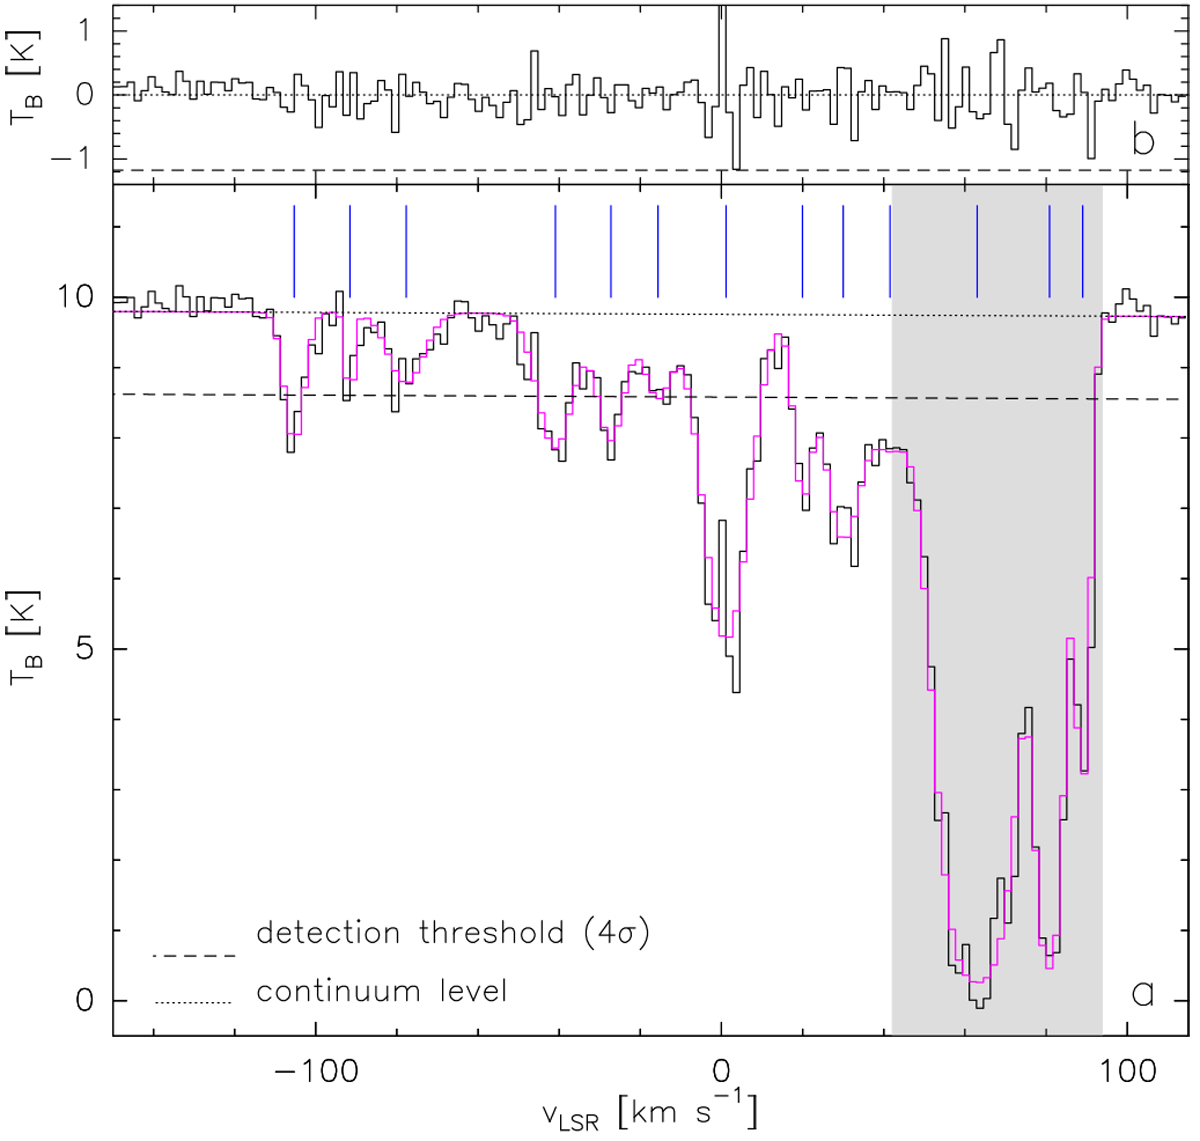
Panel a: ALMA spectrum of ortho c-C3H2 21,2 − 10,1 at 85338.896 MHz towards the UCHII region K4 (Gaume et al. 1995). The spectrum in magenta is the synthetic spectrum obtained with MCWeeds. The blue lines show the central velocities of the fitted components. The dotted line represents the continuum level and the dashed line marks the 4σ line detection threshold. The grey area marks the velocity range of the envelope of Sgr B2 (vLSR > 42 km s−1). Panel b: residuals, that is the difference between the observed and synthetic spectra. The dashed lines indicate the − 4σ level. The spectrum is corrected for the primary beam attenuation.
Current usage metrics show cumulative count of Article Views (full-text article views including HTML views, PDF and ePub downloads, according to the available data) and Abstracts Views on Vision4Press platform.
Data correspond to usage on the plateform after 2015. The current usage metrics is available 48-96 hours after online publication and is updated daily on week days.
Initial download of the metrics may take a while.