Fig. C.2
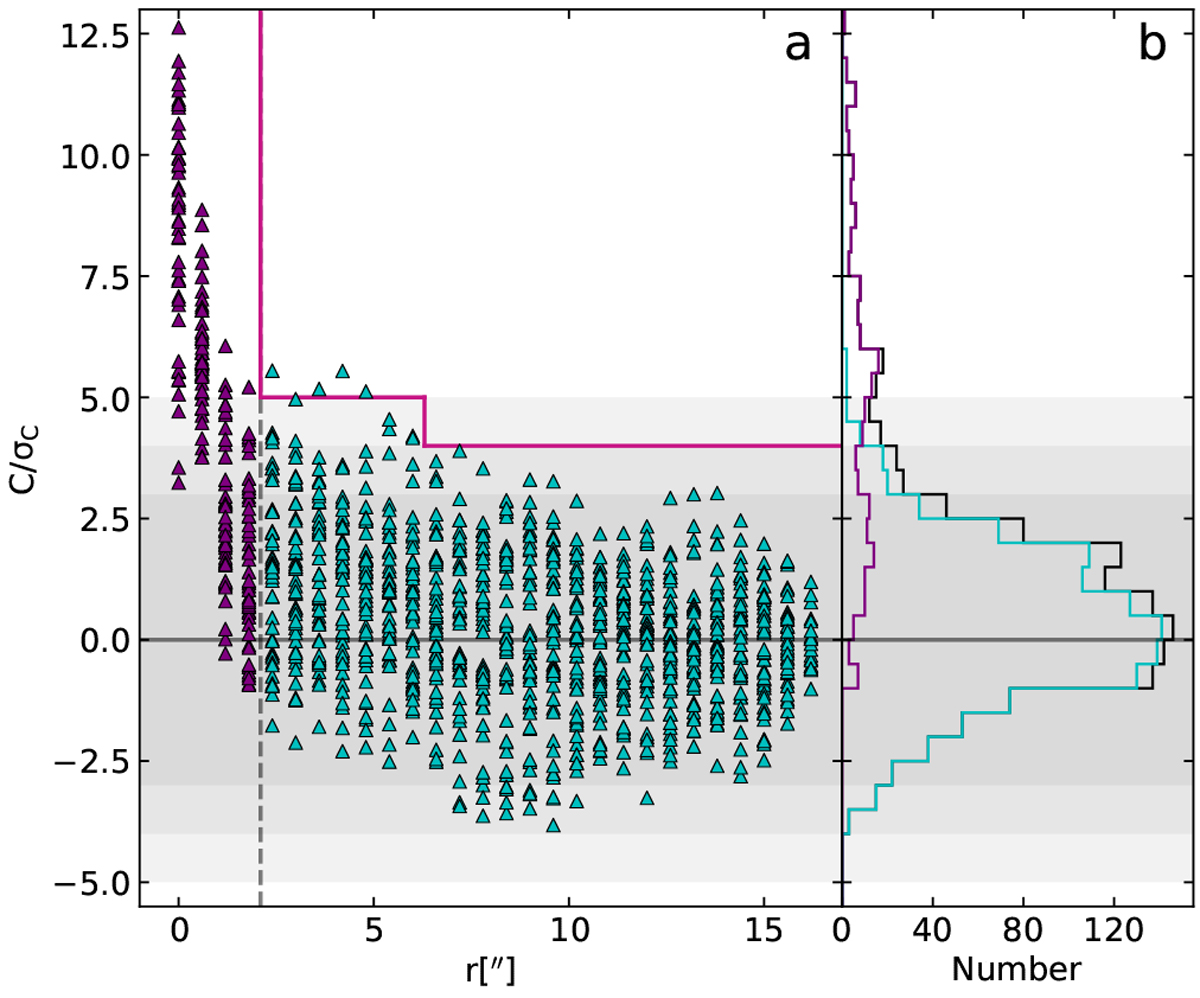
Panel a: S/N of the two-point auto-correlation functions (C(r)∕σC) of 48 noise channels, four per molecule, as a function of pixel separation r. All points at pixel separations smaller than the beam are coloured in purple, the other ones in cyan. The vertical dashed line at 2′′ correspondsto the major axis of the beam. The area above and to the right of the magenta line is the area where the correlation function of a channel containing signal indicates a significant correlation. Panel b: distribution of C∕σC. The regions of S/N smaller than 3, 4, and 5 are highlighted in shades of grey.
Current usage metrics show cumulative count of Article Views (full-text article views including HTML views, PDF and ePub downloads, according to the available data) and Abstracts Views on Vision4Press platform.
Data correspond to usage on the plateform after 2015. The current usage metrics is available 48-96 hours after online publication and is updated daily on week days.
Initial download of the metrics may take a while.