Open Access
Fig. C.1
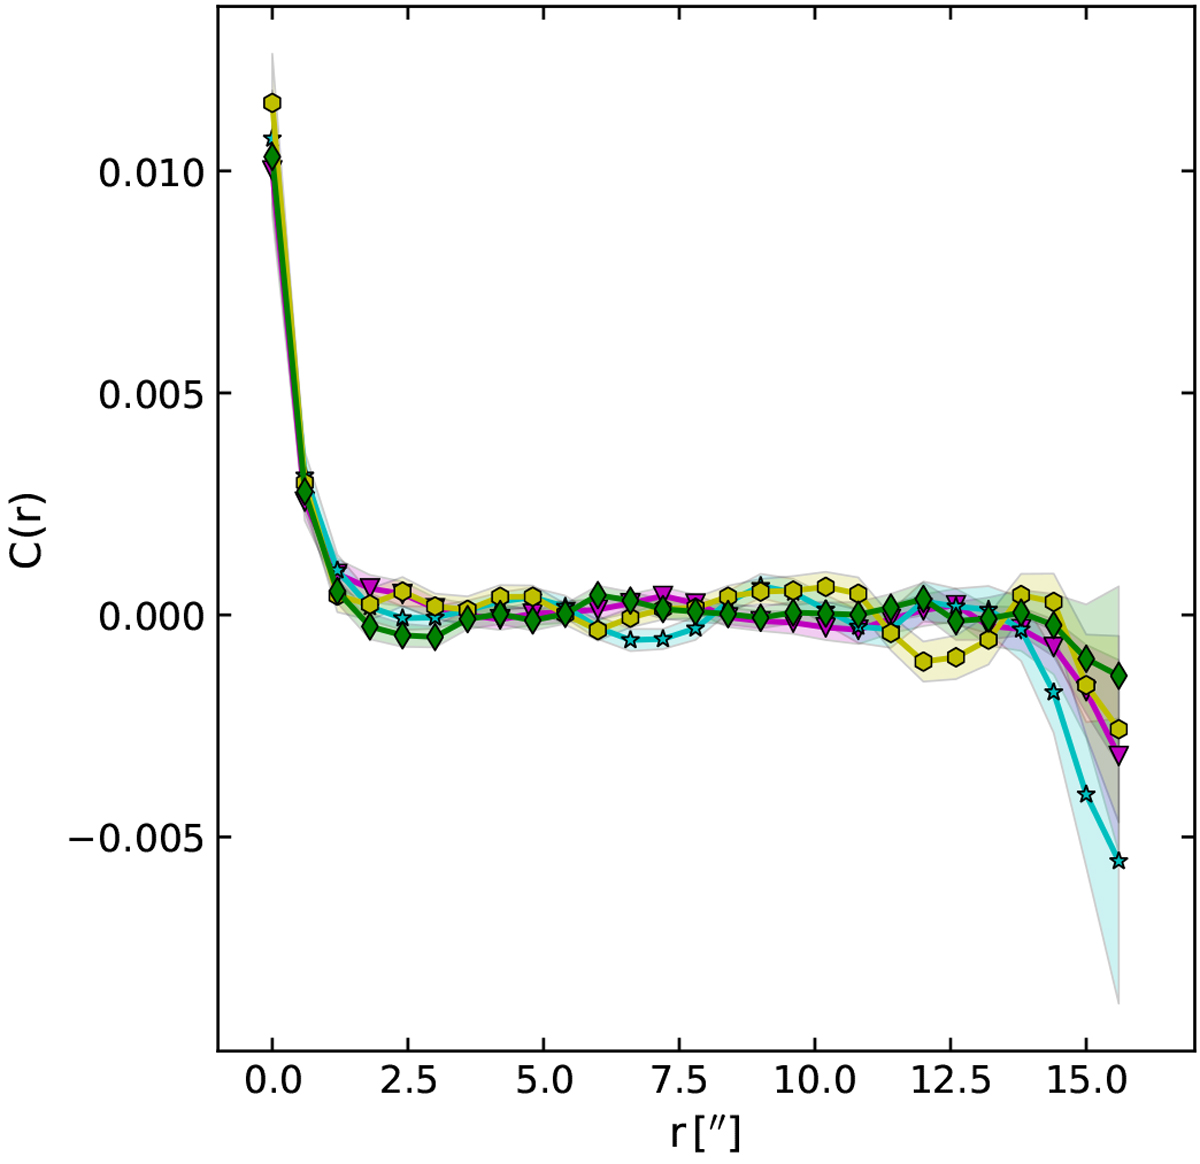
Two-point auto-correlation function C(r) of four different noise channels next to the transition of c-C3H2 as a functionof pixel separation r. The coloured regions around the curves represent the standard deviation of the 1000 realisations of the opacity cube.
Current usage metrics show cumulative count of Article Views (full-text article views including HTML views, PDF and ePub downloads, according to the available data) and Abstracts Views on Vision4Press platform.
Data correspond to usage on the plateform after 2015. The current usage metrics is available 48-96 hours after online publication and is updated daily on week days.
Initial download of the metrics may take a while.