Fig. 26
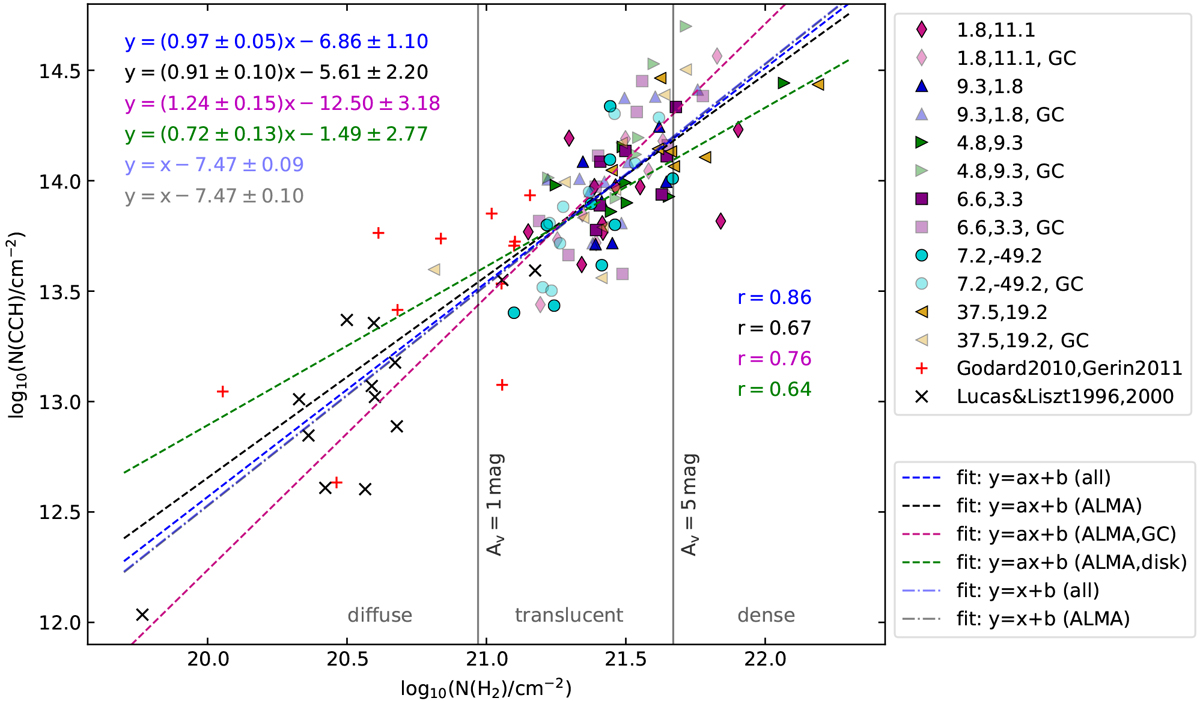
Distribution of CCH column densities versus H2 column densities, calculated from HCO+ as described in Sect. 5.1. The filled symbols represent the values obtained for the velocity components detected toward six positions with strong continuum background in the ALMA data. Their equatorial offsets are indicated tothe right. The fainter filling colours are used for the GC components. The red crosses are measurements from Godard et al. (2010) and Gerin et al. (2011) and the black ones from Lucas & Liszt (1996, 2000). The dashed lines are linear fits to the following samples: all data (blue), ALMA data only (black), ALMA GC components only (magenta), and ALMA disk components only (green). The dotted-dashed lines are fits with a slope of unity. The fits results are given in the upper left corner with their uncertainties. The Pearson correlation coefficients r are given onthe right side. The vertical lines highlight the limits between diffuse, translucent, and dense clouds.
Current usage metrics show cumulative count of Article Views (full-text article views including HTML views, PDF and ePub downloads, according to the available data) and Abstracts Views on Vision4Press platform.
Data correspond to usage on the plateform after 2015. The current usage metrics is available 48-96 hours after online publication and is updated daily on week days.
Initial download of the metrics may take a while.