Fig. 25
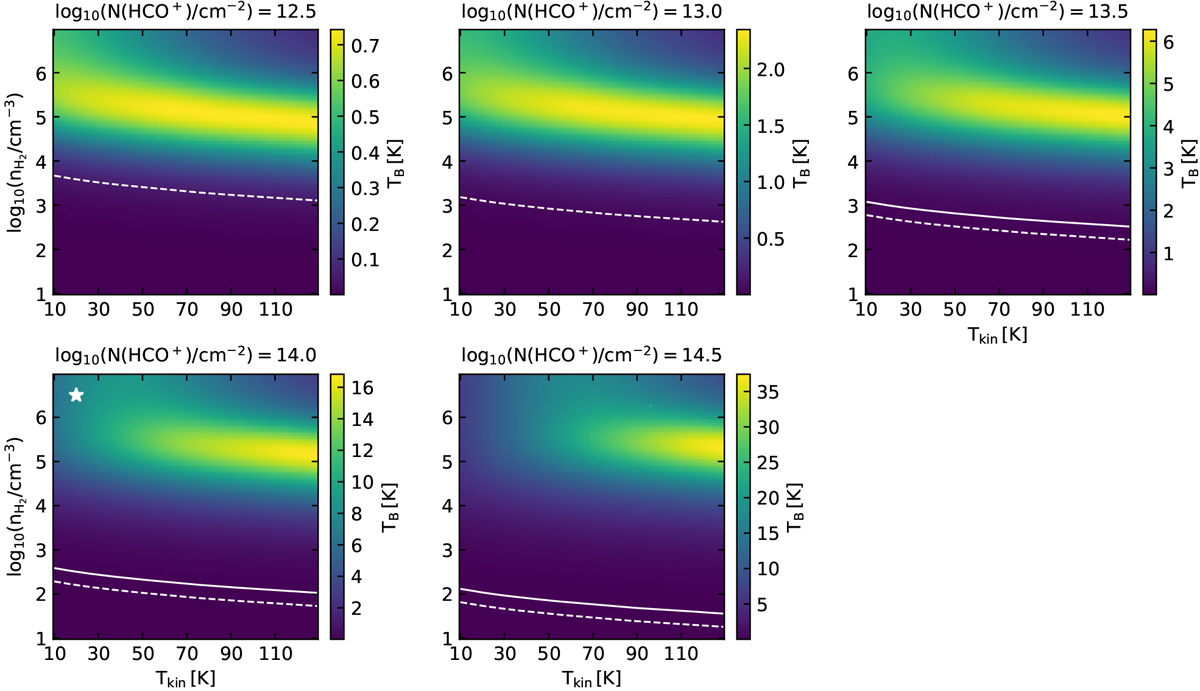
HCO+ 1–0 brightness temperature computed with RADEX as a function of kinetic temperature (x-axis) and H2 density (y-axis), assuming different column densities. In each panel, the solid line corresponds to the level of emission measured in the Mopra spectrum around 14 km s−1 and the dashed line to the upper limit (3σ) over the velocity range from − 110 km s−1 to − 10 km s−1. The solid line is displayed only for the column densities that fall in the range determined from the ALMA absorption map at this velocity and the white star marks the median column density obtained from the ALMA absorption map at this velocity.
Current usage metrics show cumulative count of Article Views (full-text article views including HTML views, PDF and ePub downloads, according to the available data) and Abstracts Views on Vision4Press platform.
Data correspond to usage on the plateform after 2015. The current usage metrics is available 48-96 hours after online publication and is updated daily on week days.
Initial download of the metrics may take a while.