Fig. 23
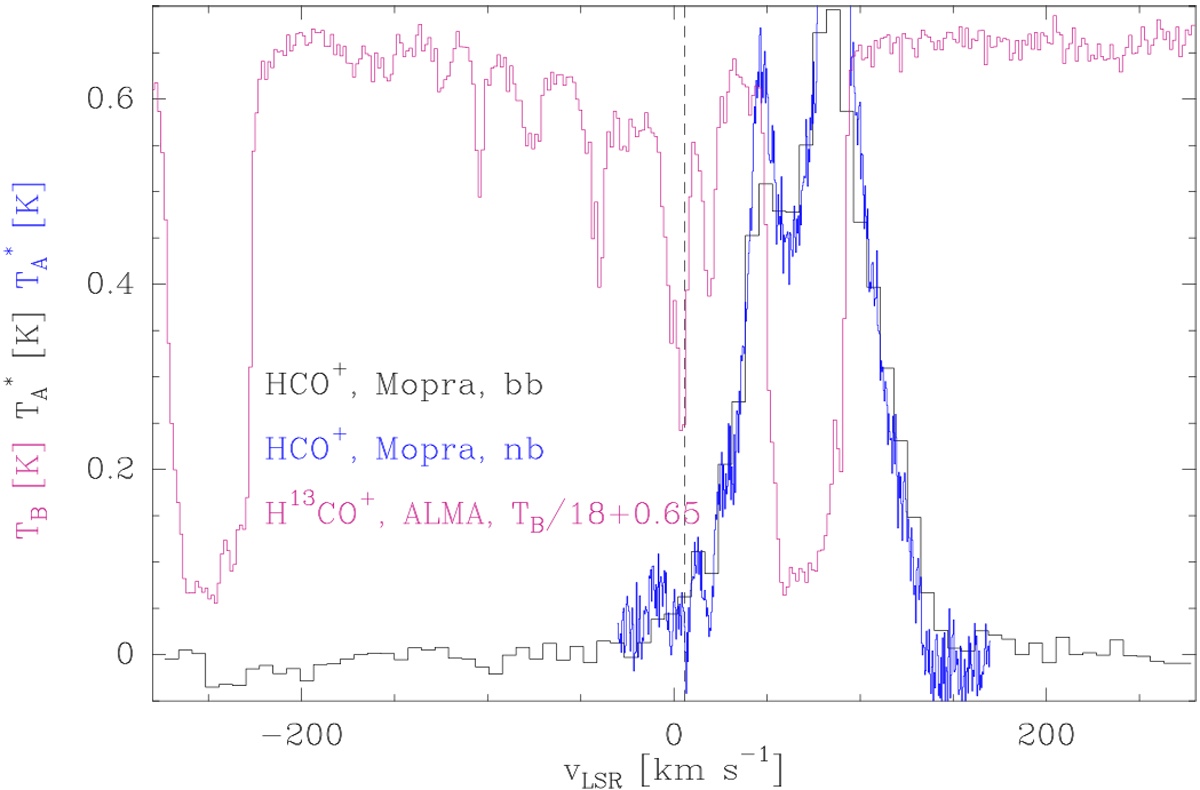
Mopra average spectrum of HCO+
1–0 towards Sgr B2(N), extracted from the imaging survey of Jones et al. (2008) after excluding pixels with absorption (see Fig. 22). The black and blue spectra were obtained with the broad-band and narrow-band backends, respectively. They are displayed in
![]() scale. The purple spectrum is the EMoCA spectrum of H13CO+
1–0 towards K4 in brightness temperature scale. The feature between −280 and −210 km s−1
is caused by SiO in the envelope of Sgr B2. The dashed line marks the channel that corresponds to a
13CO emission peak in Fig. 24.
scale. The purple spectrum is the EMoCA spectrum of H13CO+
1–0 towards K4 in brightness temperature scale. The feature between −280 and −210 km s−1
is caused by SiO in the envelope of Sgr B2. The dashed line marks the channel that corresponds to a
13CO emission peak in Fig. 24.
Current usage metrics show cumulative count of Article Views (full-text article views including HTML views, PDF and ePub downloads, according to the available data) and Abstracts Views on Vision4Press platform.
Data correspond to usage on the plateform after 2015. The current usage metrics is available 48-96 hours after online publication and is updated daily on week days.
Initial download of the metrics may take a while.