Fig. 22
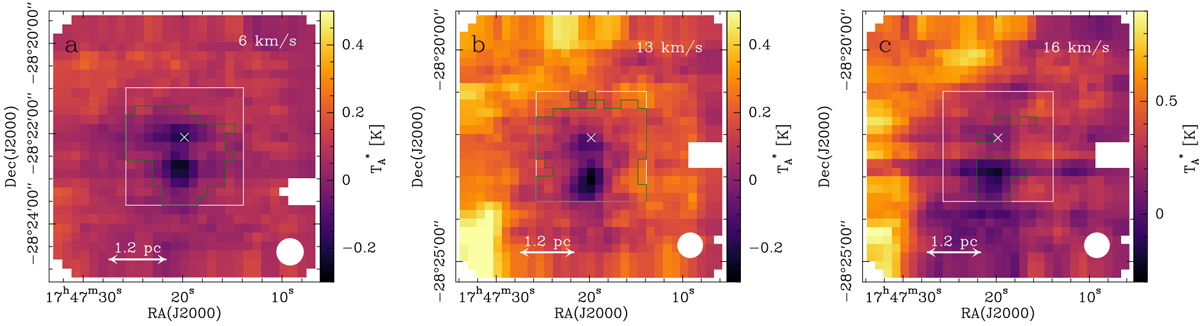
Mopra channel maps in the direction of Sgr B2 at about 14 km s−1 for HCO+ 1–0 (panel a), HNC 1–0 (panel b), and CS 2–1 (panel c) as observed by Jones et al. (2008). In each panel, the white box shows the region selected to calculate the averaged spectrum and the green contour encloses the pixels that were masked to avoid absorption. The white circle in the lower right corner of each panel represents the beam and the cross indicates the position of K4. The pixel size is 12′′.
Current usage metrics show cumulative count of Article Views (full-text article views including HTML views, PDF and ePub downloads, according to the available data) and Abstracts Views on Vision4Press platform.
Data correspond to usage on the plateform after 2015. The current usage metrics is available 48-96 hours after online publication and is updated daily on week days.
Initial download of the metrics may take a while.