Fig. 20
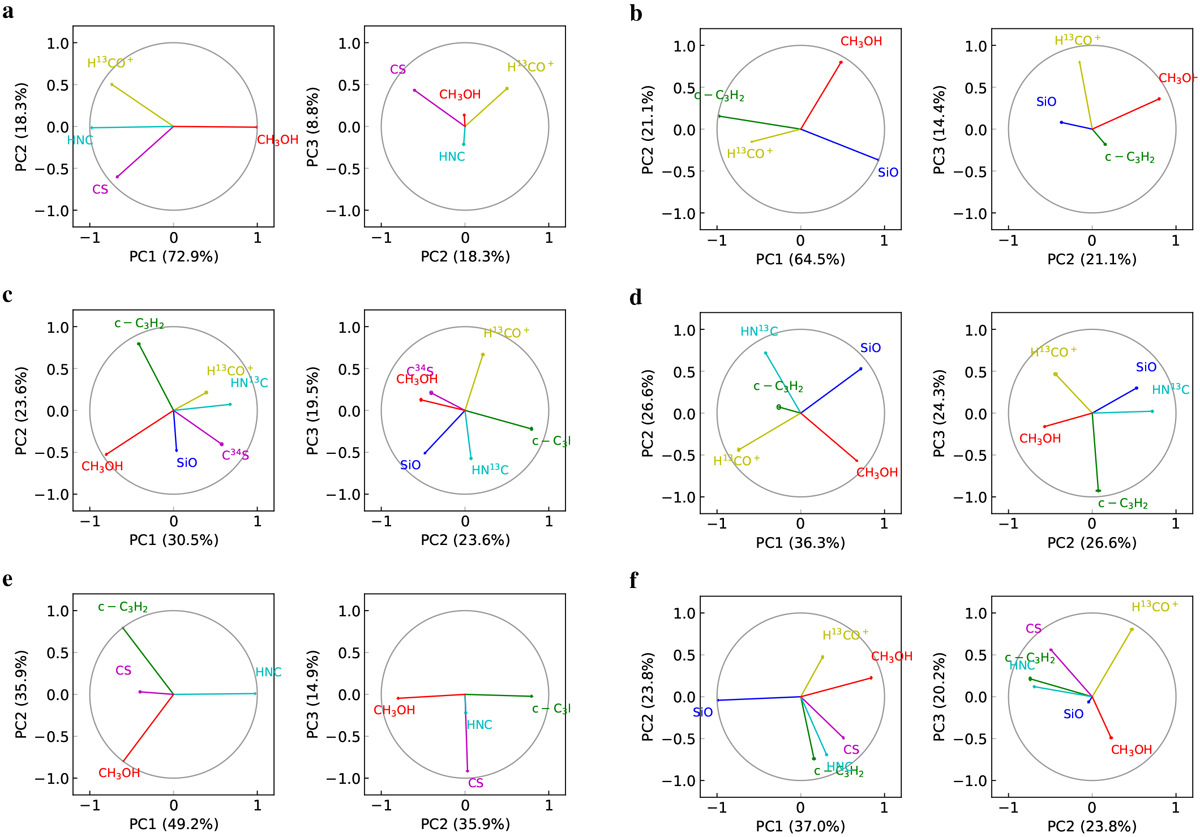
Correlation wheels for PCs at vLSR = 24.7 km s−1 (panels a), − 105.9 km s−1 (panels b), 2.0 km s−1 (panels c), 7.3 km s−1 (panels d), 31.6 km s−1 (panels e), and 17.7 km s−1 (panels f). The percentages in parentheses give the contributions of the PCs to the total variance. The ellipses around the arrow heads show the uncertainties estimated from 1000 realisations of the opacity cubes.
Current usage metrics show cumulative count of Article Views (full-text article views including HTML views, PDF and ePub downloads, according to the available data) and Abstracts Views on Vision4Press platform.
Data correspond to usage on the plateform after 2015. The current usage metrics is available 48-96 hours after online publication and is updated daily on week days.
Initial download of the metrics may take a while.