Open Access
Fig. 19
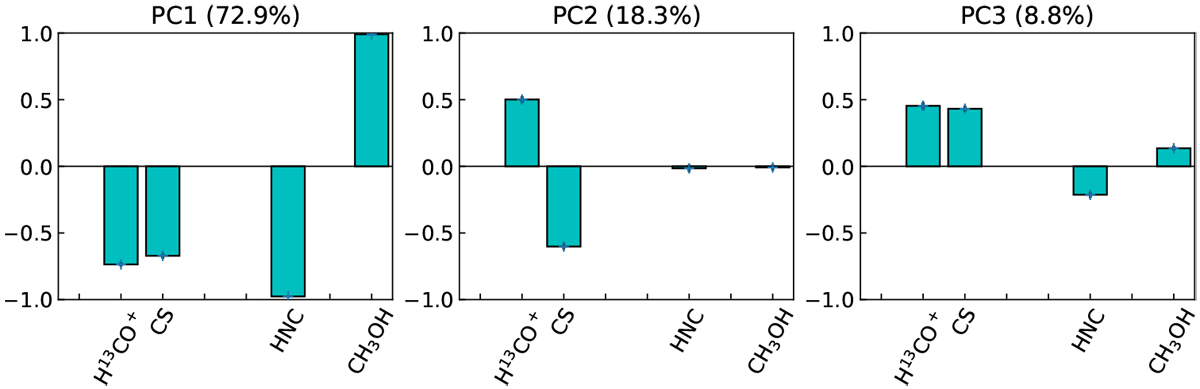
Principal component coefficients determined at vLSR = 24.7 km s−1. The contribution factors of each molecule are normalised such that the sum of the squares is equal to 1. The percentages in parentheses give the contributions of the PCs to the total variance.
Current usage metrics show cumulative count of Article Views (full-text article views including HTML views, PDF and ePub downloads, according to the available data) and Abstracts Views on Vision4Press platform.
Data correspond to usage on the plateform after 2015. The current usage metrics is available 48-96 hours after online publication and is updated daily on week days.
Initial download of the metrics may take a while.