Fig. 16
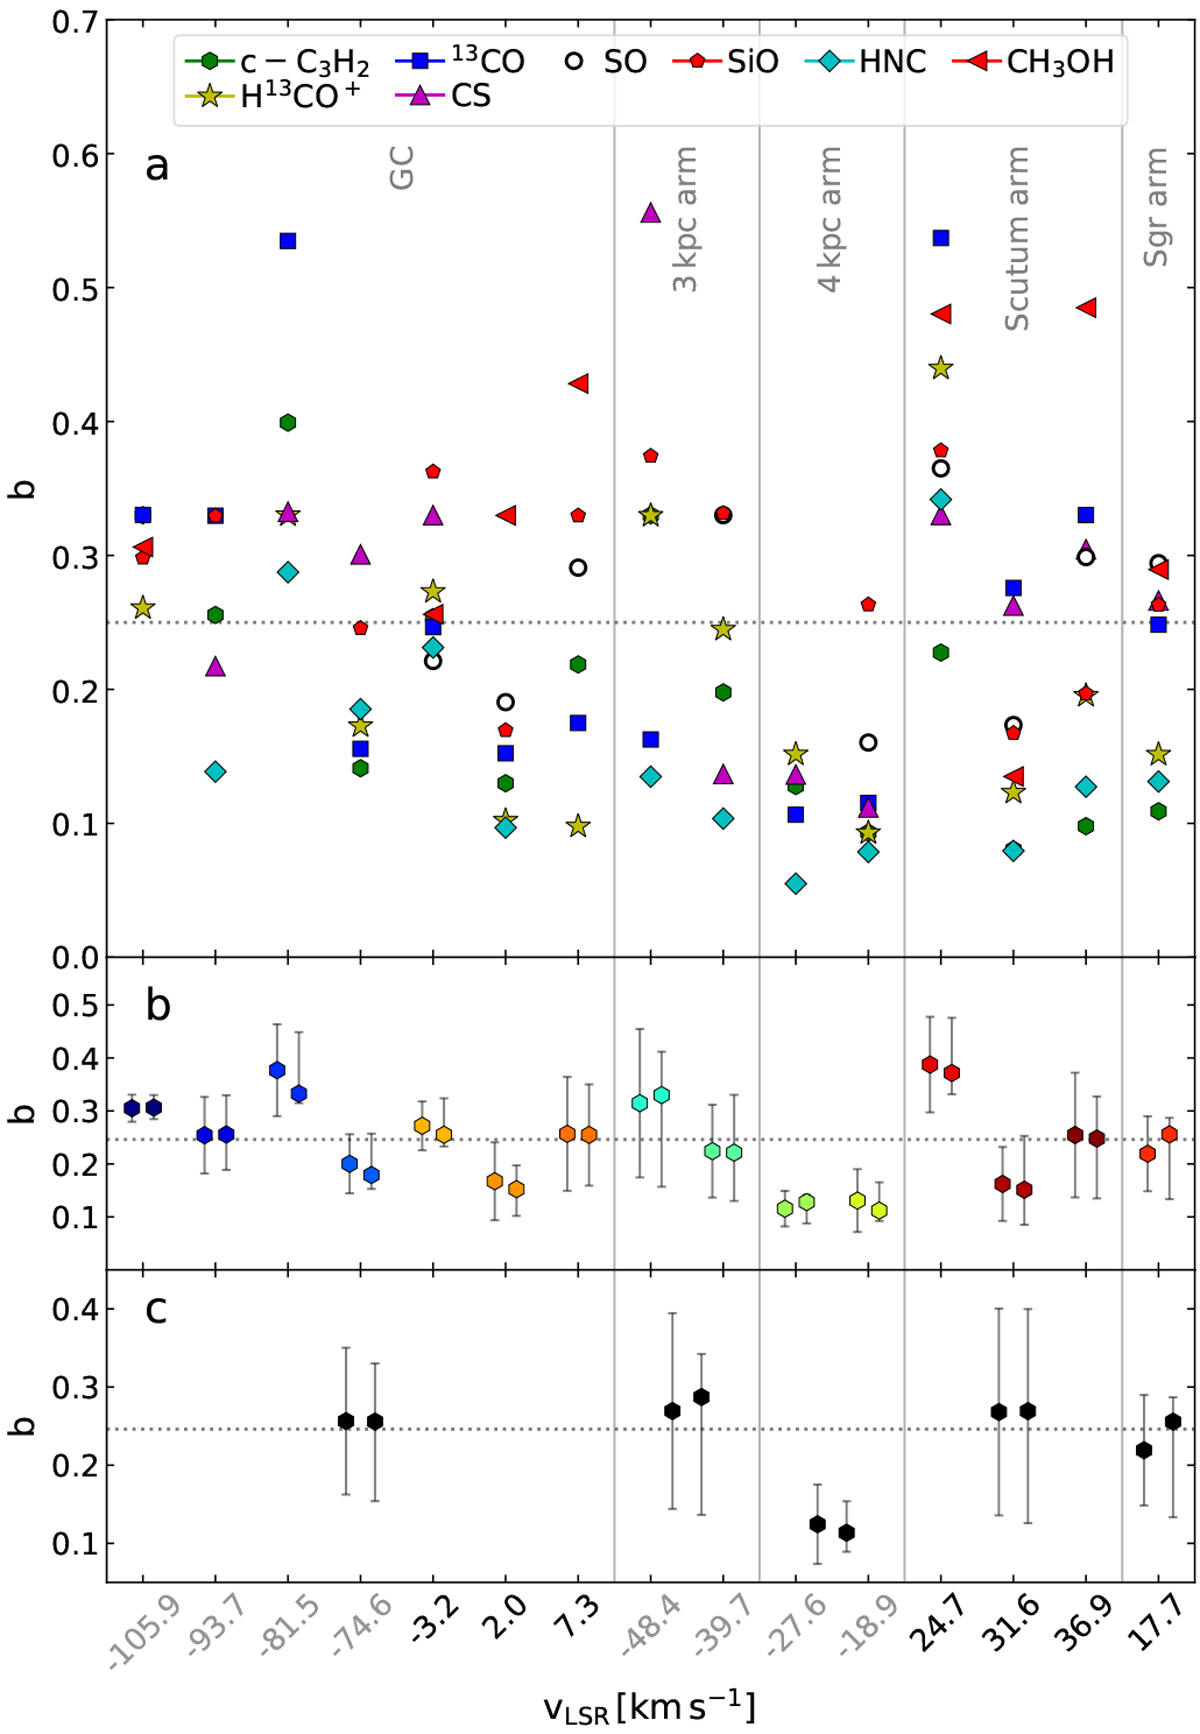
Panel a: forcing parameter b of eight molecules, assuming Tkin = 40 K for the 15 velocity components roughly sorted by their distance to the Galactic centre. Panel b: mean (left) and median (right) values for each velocity component. Panel c: mean (left) and median (right) values for each sub-sample of clouds, from left to right: Galactic centre, 3 kpc arm, 4 kpc arm, Scutum arm, Sagittarius arm. The uncertainties represent the standard deviation for the mean and the corresponding percentiles for the median. The dashed line in each panel marks the median value of all data points shown in panel a. The velocities of the components belonging to Categories I and II are colouredin grey and black, respectively.
Current usage metrics show cumulative count of Article Views (full-text article views including HTML views, PDF and ePub downloads, according to the available data) and Abstracts Views on Vision4Press platform.
Data correspond to usage on the plateform after 2015. The current usage metrics is available 48-96 hours after online publication and is updated daily on week days.
Initial download of the metrics may take a while.