Fig. 10
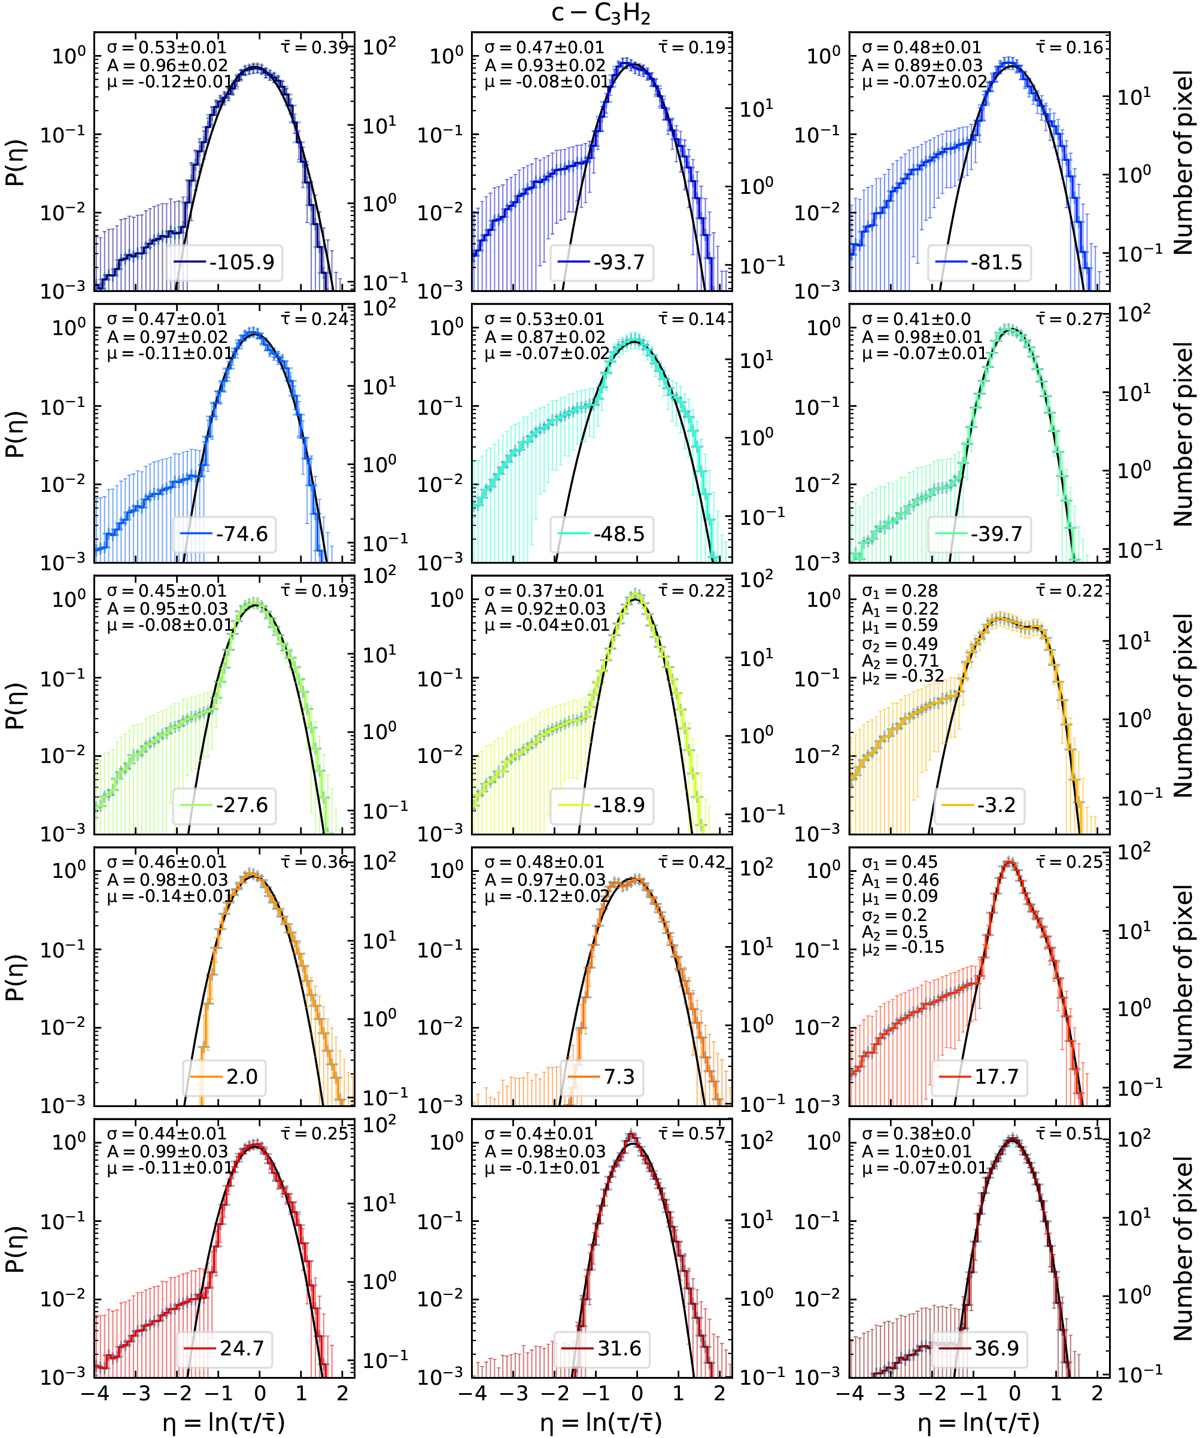
Probability distribution functions P(η) of the velocity components probed with c-C3H2. The velocity of the component is indicated at the bottom of each panel in km s−1. The right y-axis indicates thenumber of pixels counted in each bin. The mean opacity ![]() is given in the upper right corner and the parameters of the fitted Gaussian(s) in the upper left corner: dispersion
σ, integral A, and centre μ.
is given in the upper right corner and the parameters of the fitted Gaussian(s) in the upper left corner: dispersion
σ, integral A, and centre μ.
Current usage metrics show cumulative count of Article Views (full-text article views including HTML views, PDF and ePub downloads, according to the available data) and Abstracts Views on Vision4Press platform.
Data correspond to usage on the plateform after 2015. The current usage metrics is available 48-96 hours after online publication and is updated daily on week days.
Initial download of the metrics may take a while.