Fig. 6.
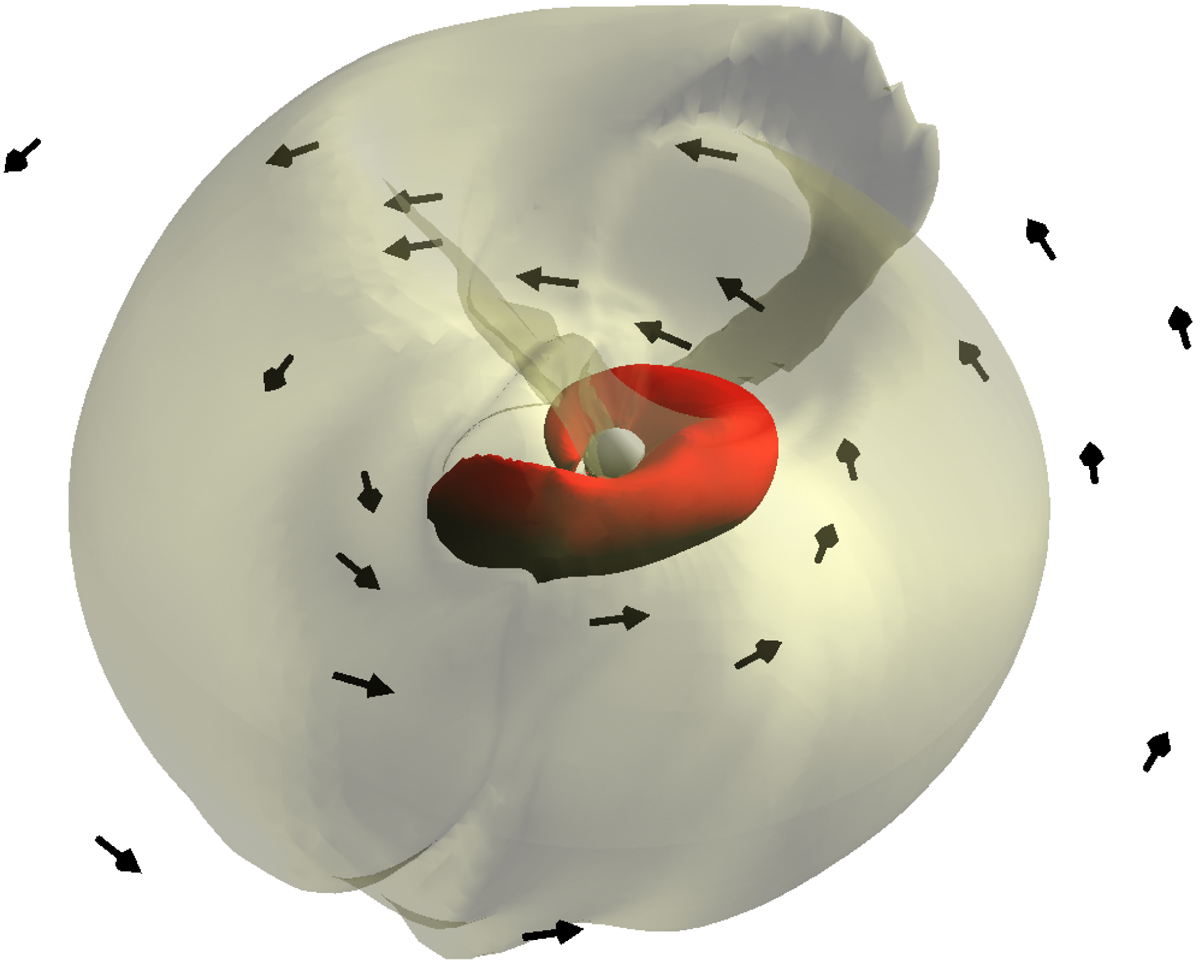
Three-dimensional contours of the mass density for the isentropic HS configuration (upper panels in Fig. 5); the yellow semitransparent surface is 5 times less dense than the inner red surface. The arrows stand for the velocity field in the orbital plane. The flow comes from the upper left. Spiral arms are visible for each surface. The central white sphere stands for the inner boundary of the simulation space, ∼200 times smaller than the outer boundary shown in Fig. 1.
Current usage metrics show cumulative count of Article Views (full-text article views including HTML views, PDF and ePub downloads, according to the available data) and Abstracts Views on Vision4Press platform.
Data correspond to usage on the plateform after 2015. The current usage metrics is available 48-96 hours after online publication and is updated daily on week days.
Initial download of the metrics may take a while.