Fig. 5.
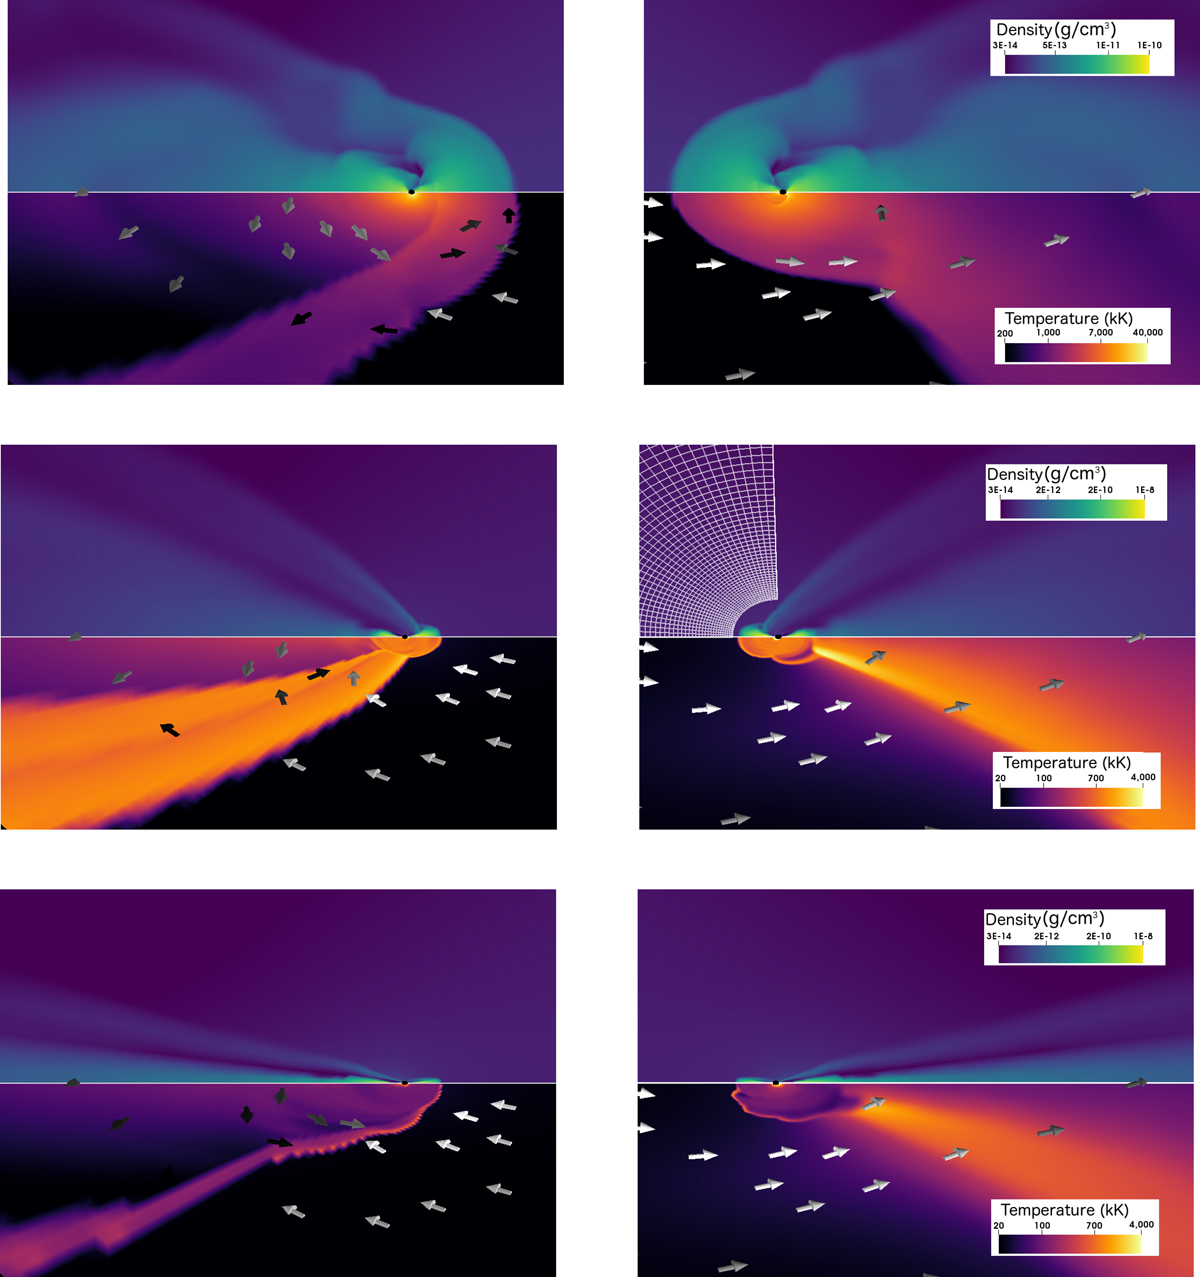
Side views of the flow structure when cooling is triggered using an isentropic (upper panels) or an isothermal prescription, with a high temperature (middle panels) or low temperature (lower panels). In the left (resp. right) column, the wind comes from the right (resp. left). The lower half of each panel shows a logarithmic thermal color map in the orbital plane while the upper half represents the transverse (or “vertical”) logarithmic density distribution. We also plotted the velocity field in the orbital plane with a white to black color scale to indicate a slowing down by a factor of at least 4. The radially stretched mesh is represented to indicate the resolution.
Current usage metrics show cumulative count of Article Views (full-text article views including HTML views, PDF and ePub downloads, according to the available data) and Abstracts Views on Vision4Press platform.
Data correspond to usage on the plateform after 2015. The current usage metrics is available 48-96 hours after online publication and is updated daily on week days.
Initial download of the metrics may take a while.