Fig. 3.
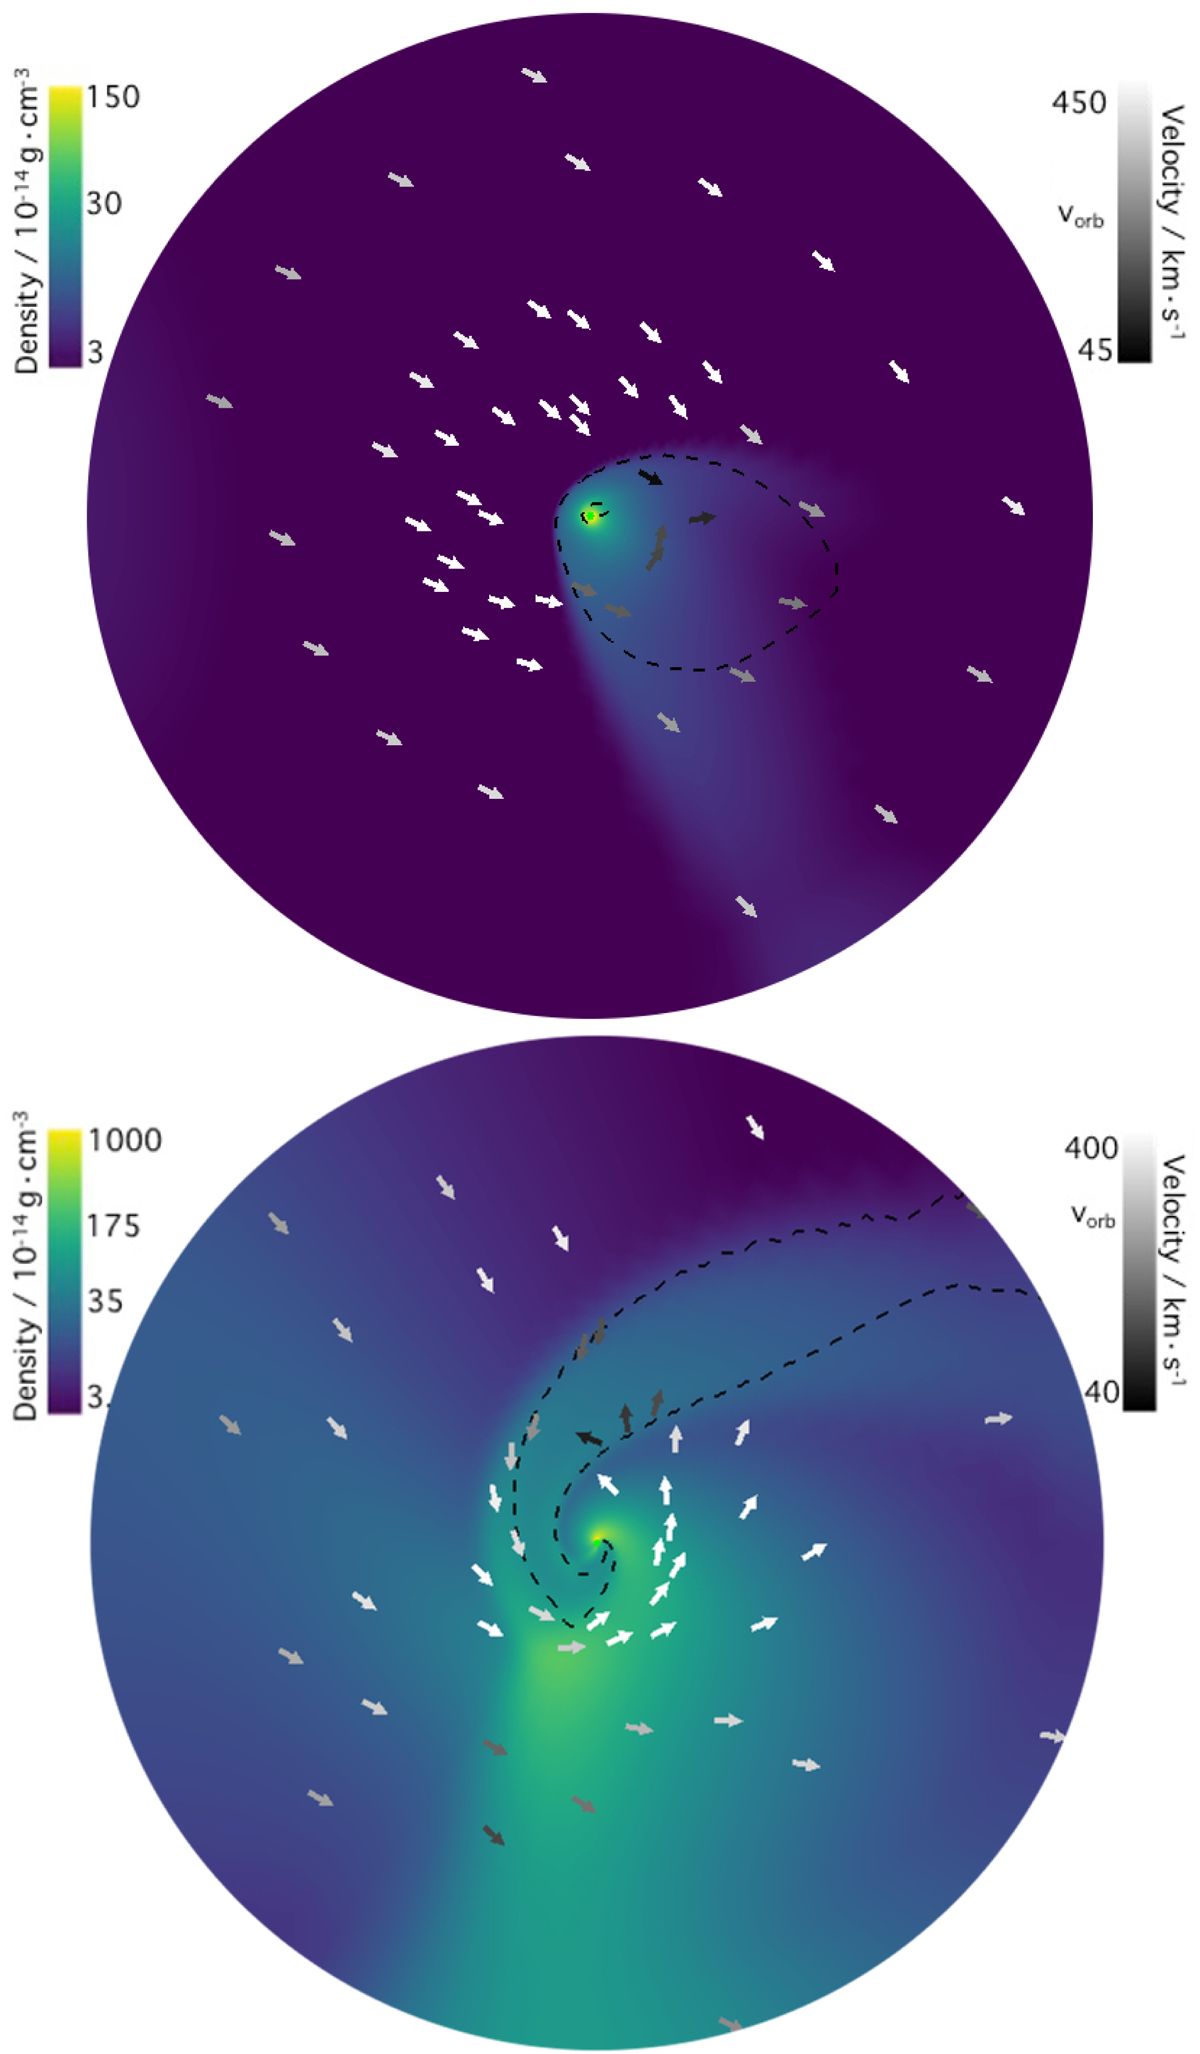
Logarithmic color maps of the density field in the orbital plane. The arrows stand for the velocity field; the black to white color map indicates their increasing magnitude. The orbital speed of Vela X-1, vorb ∼ 284 km s−1, is represented (linear scale). The black dashed line indicates the Mach-1 contour. The radial extension of the simulation domain relative to the orbital separation corresponds to the green dashed delimited regions in Fig. 1, which is approximately the Roche lobe of the accretor. Bottom panel: LF configuration. Top panel: HS configuration.
Current usage metrics show cumulative count of Article Views (full-text article views including HTML views, PDF and ePub downloads, according to the available data) and Abstracts Views on Vision4Press platform.
Data correspond to usage on the plateform after 2015. The current usage metrics is available 48-96 hours after online publication and is updated daily on week days.
Initial download of the metrics may take a while.