Fig. 2.
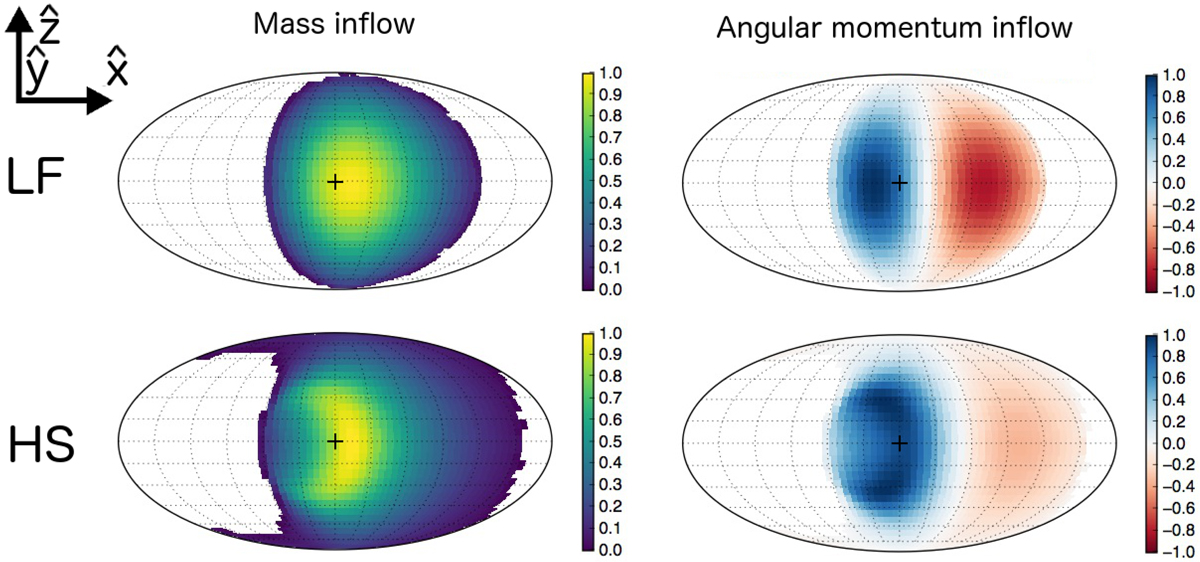
Mollweide projections of local mass and angular momentum inflows within the simulation space centered on the accretor (dashed green sphere on Fig. 1). The upper row corresponds to the light fast (LF) case while the bottom row is for the heavy slow (HS) case. Each map is scaled to its maximum (absolute) value and centered on the axis from the accretor to the donor star (central dark cross). No mass inflow is measured in the white angular regions of the left maps (i.e., they are not reached by any of the ballistic streamlines). Positive (resp. negative) values of angular momentum stands for locally prograde (resp. retrograde) flow with respect to the orbital motion.
Current usage metrics show cumulative count of Article Views (full-text article views including HTML views, PDF and ePub downloads, according to the available data) and Abstracts Views on Vision4Press platform.
Data correspond to usage on the plateform after 2015. The current usage metrics is available 48-96 hours after online publication and is updated daily on week days.
Initial download of the metrics may take a while.