Fig. 2.
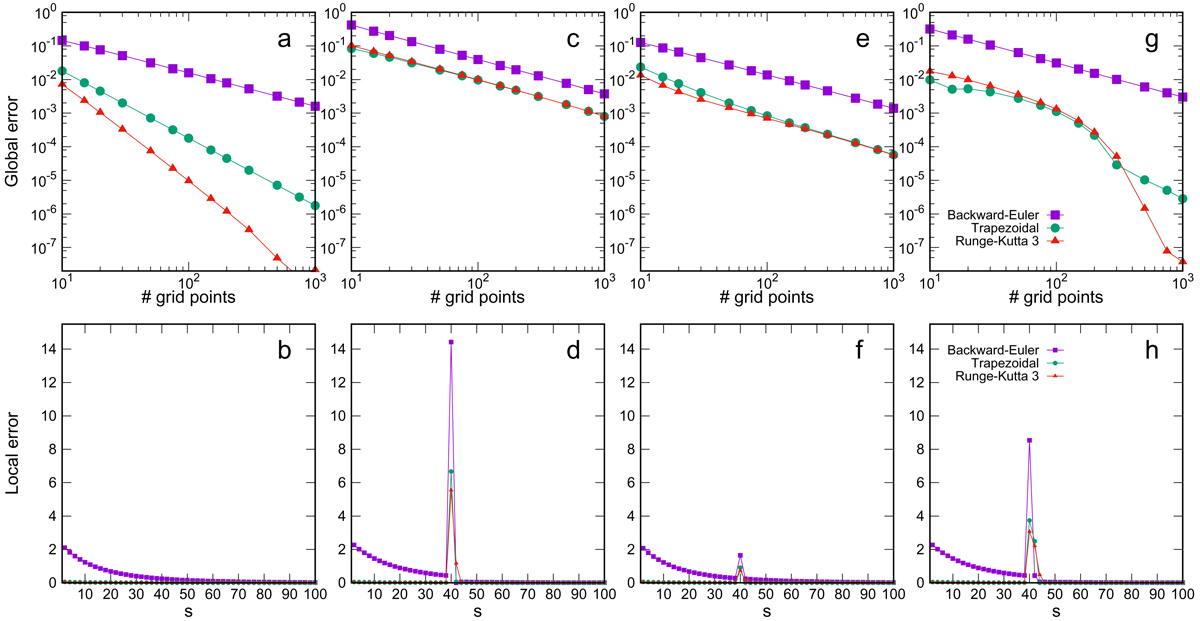
Top row: log-log representation of the global error in the emergent intensity profile as a function of the number of grid-points. Bottom row: local error as a function of the spatial coordinate s ∈ [0, 100] for a sampling of 50 equispaced grid points for a single wavelength near the line core. The four columns correspond to four different atmospheric models, where the absorption coefficient χν and emissivity ϵν are given, respectively, by Eqs. (20) and (21) (first column), by Eqs. (22) and (23) (second column), by Eqs. (24) and (25) (third column), and by Eqs. (26) and (27) (fourth column). The parameters are: c1 = 0.01, c2 = 0.05, c3 = 0.15, k1 = 1/25, k2 = 1/15, k3 = 5, j1 = 2, j2 = 20, sd1 = 39.985, and sd2 = 39.955. This choice of sd1 and sd2 warrants a monotonic approach of the grid points to the location of the discontinuity (or sharp gradient) as the grid sampling is refined. The global and the local error are computed as exposed in Eqs. (A.1) (considering the Stokes I component only) and (A.2), respectively, with a reference atmospheric model with 104 grid points.
Current usage metrics show cumulative count of Article Views (full-text article views including HTML views, PDF and ePub downloads, according to the available data) and Abstracts Views on Vision4Press platform.
Data correspond to usage on the plateform after 2015. The current usage metrics is available 48-96 hours after online publication and is updated daily on week days.
Initial download of the metrics may take a while.