Fig. 1.
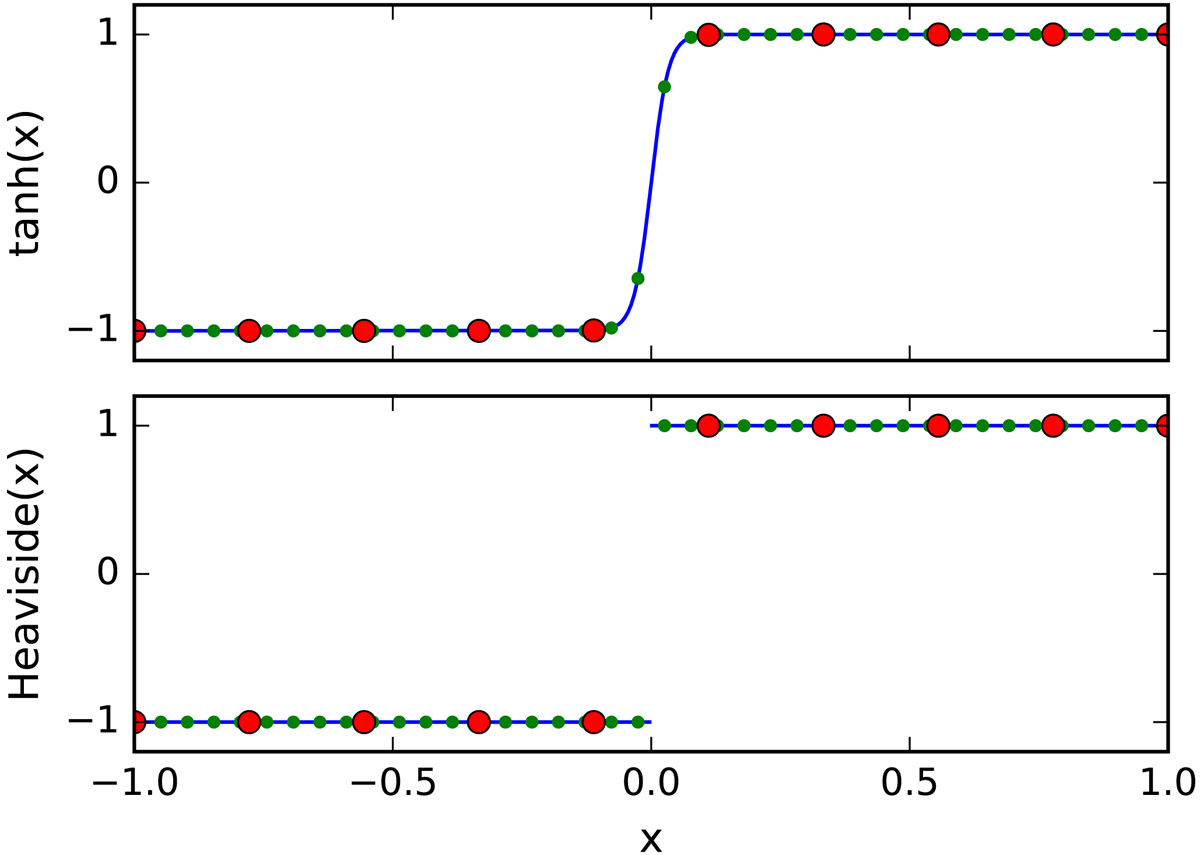
The hyperbolic tangent (top panel, continuous blue) and the modified Heaviside (bottom panel, continuous blue) functions are sampled in the interval x ∈ [−1, 1] with 10 (red circles) and 40 (green dots) grid points. No difference between the coarser (red) samplings is visible, while this is not true for the finer (green) samplings.
Current usage metrics show cumulative count of Article Views (full-text article views including HTML views, PDF and ePub downloads, according to the available data) and Abstracts Views on Vision4Press platform.
Data correspond to usage on the plateform after 2015. The current usage metrics is available 48-96 hours after online publication and is updated daily on week days.
Initial download of the metrics may take a while.