Fig. 8.
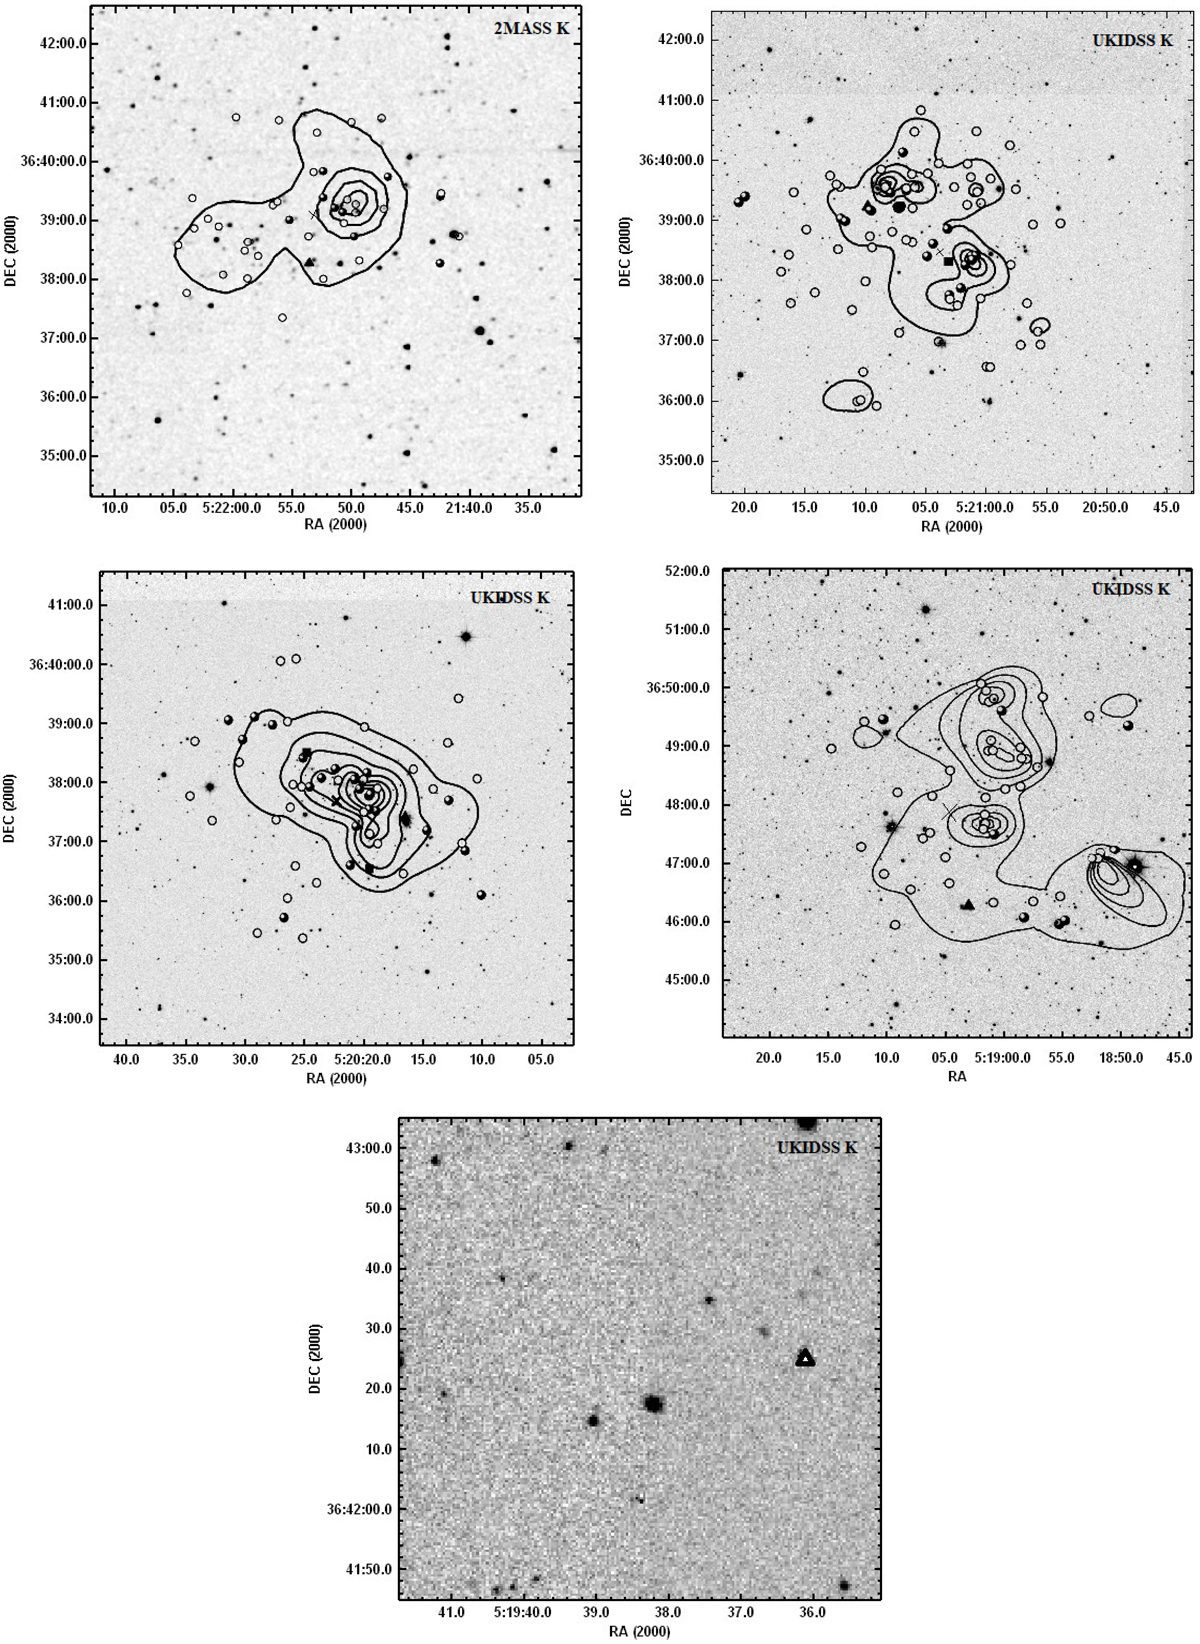
LD distribution of the YSOs and spatial distribution of the Class I and Class II objects superposed on the K-band images. Filled and open circles represent the Class I and Class II objects, respectively. The triangles and squares show the location of IRAS and MSX sources, respectively, which are also classified as Class I objects. The geometric center of each subregion is indicated by a cross.
Current usage metrics show cumulative count of Article Views (full-text article views including HTML views, PDF and ePub downloads, according to the available data) and Abstracts Views on Vision4Press platform.
Data correspond to usage on the plateform after 2015. The current usage metrics is available 48-96 hours after online publication and is updated daily on week days.
Initial download of the metrics may take a while.