Fig. 5.
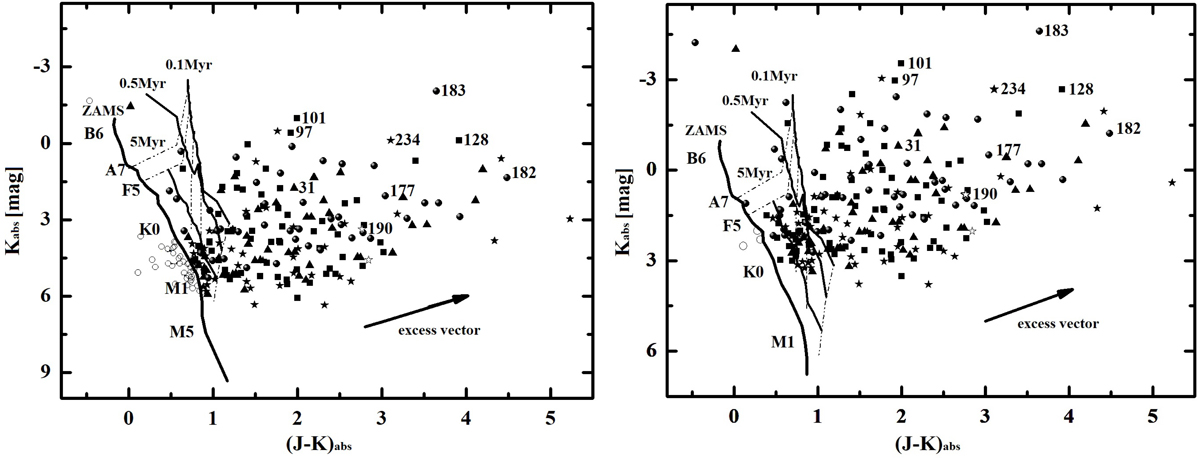
K vs. (J–K) color–magnitude diagrams for the identified YSOs in subregions. The PMS isochrones for 0.1, 0.5, and 5 Myr by Siess et al. (2000) and ZAMS are drawn as solid thin and thick lines, respectively. Dashed lines represent the evolutionary tracks for different masses. The positions of a few spectral types are labeled. The J and K magnitudes of the YSOs are corrected for the interstellar extinctions determined according to the COBE/DIRBE and IRAS/ISSA maps and distances 1.88 kpc (left panel) and 6.1 kpc (right panel), respectively. The arrow indicates the average slope of NIR excesses caused by disks around YSOs, as determined by López-Chico & Salas (2007). The objects belonging to different subregions are shown as follows: IRAS 05184+3635 (triangles), IRAS 05177+3636 (square), IRAS 05168+3634 (filled circles), IRAS 05162+3639 (open stars), and IRAS 05156+3643 (filled stars). Open circles indicate objects considered members of subregions, but in the color–magnitude diagram they are located to the left of ZAMS. The IRAS and MSX sources are labeled (see Table A.1).
Current usage metrics show cumulative count of Article Views (full-text article views including HTML views, PDF and ePub downloads, according to the available data) and Abstracts Views on Vision4Press platform.
Data correspond to usage on the plateform after 2015. The current usage metrics is available 48-96 hours after online publication and is updated daily on week days.
Initial download of the metrics may take a while.