Fig. 3.
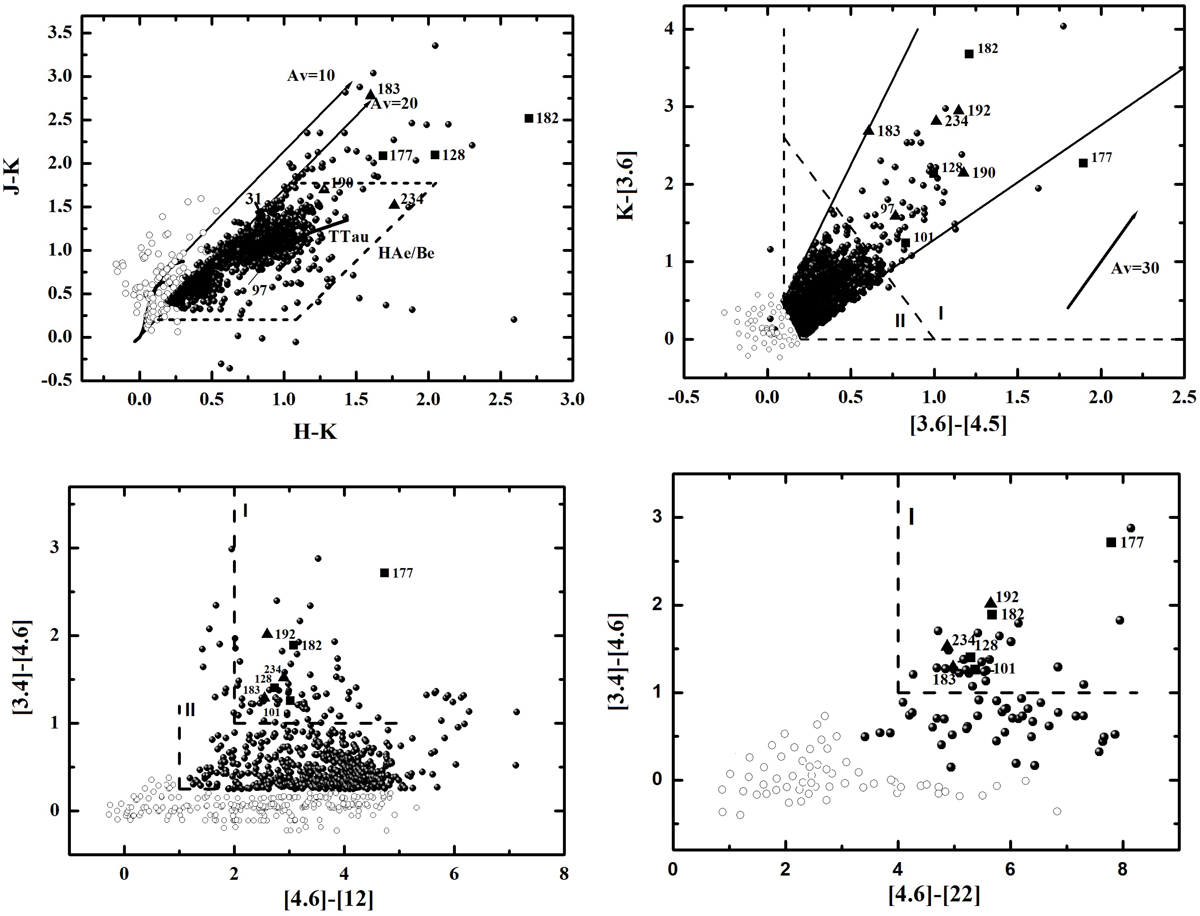
Color–color diagrams of the region. Top left panel: (J–H) vs. (H–K) diagram. The dwarf and giant loci (solid and dashed curves, respectively) are from Bessell & Brett (1988) and were converted to the CIT system (Carpenter 2001). The parallel lines represent the interstellar reddening vectors (Rieke & Lebofsky 1985). The locus of unreddened classical T Tauri stars is from Meyer et al. (1997), and the region bounded by dashed lines is the Herbig Ae/Be stars location (Hernández et al. 2005). Top right panel: K-[3.6] vs. [3.6]–[4.5] diagram. In this diagram Class I and II domains are separated by the dashed line. The arrow shows the extinction vector (Flaherty et al. 2007). All the lines in the K-[3.6] vs. [3.6]–[4.5] diagram are from Allen et al. (2007). Bottom left and right panels: [3.4]–[4.6] vs. [4.6]–[12] and [3.4]–[4.6] vs. [4.6]–[22] diagrams. The filled circles are selected YSOs and open circles are unclassified ones. Not all unclassified objects are presented in these diagrams. IRAS and MSX sources are indicated by triangles and squares, respectively, and they are labeled (see Tables A.1 and A.2).
Current usage metrics show cumulative count of Article Views (full-text article views including HTML views, PDF and ePub downloads, according to the available data) and Abstracts Views on Vision4Press platform.
Data correspond to usage on the plateform after 2015. The current usage metrics is available 48-96 hours after online publication and is updated daily on week days.
Initial download of the metrics may take a while.