Free Access
Fig. 2.
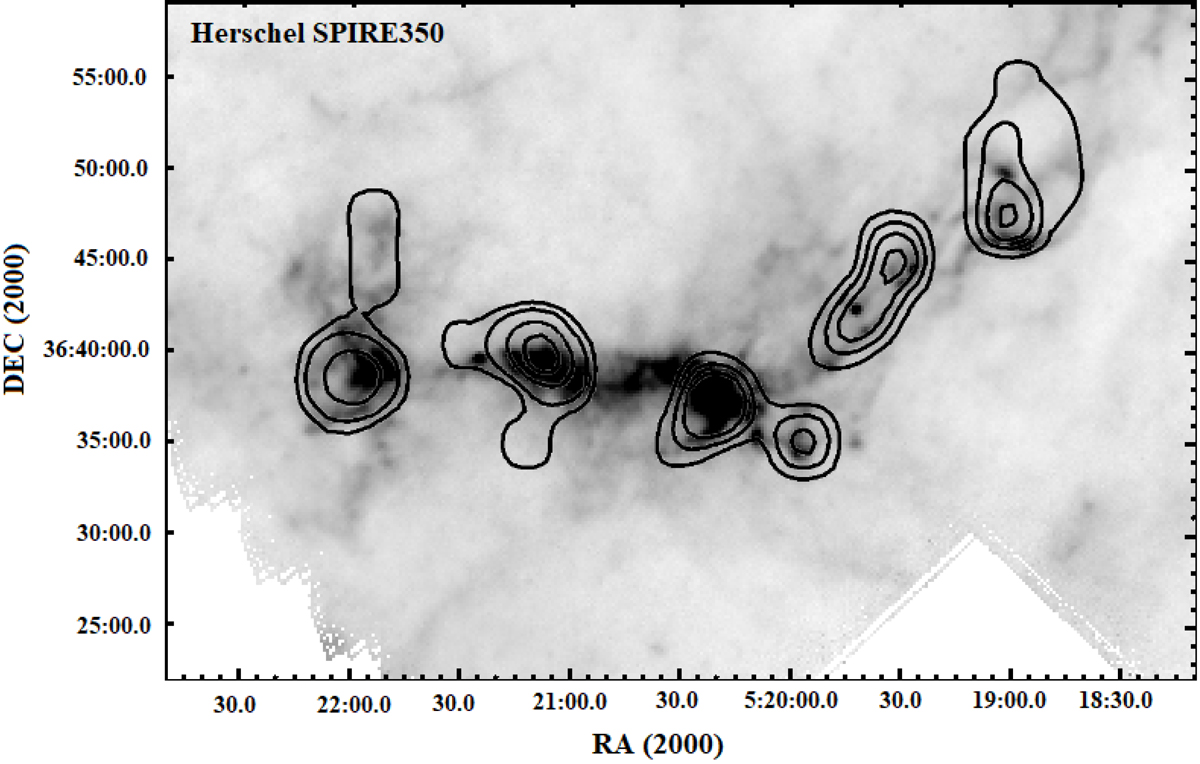
Stellar surface density distribution based on Herschel PACS 160 μm photometry. Stellar surface density distribution map is overplotted on Herschel SPIRE 350 μm image. The surface density of the last isodences exceeds the average value of the field surface density on 1σ.
Current usage metrics show cumulative count of Article Views (full-text article views including HTML views, PDF and ePub downloads, according to the available data) and Abstracts Views on Vision4Press platform.
Data correspond to usage on the plateform after 2015. The current usage metrics is available 48-96 hours after online publication and is updated daily on week days.
Initial download of the metrics may take a while.