Fig. 6.
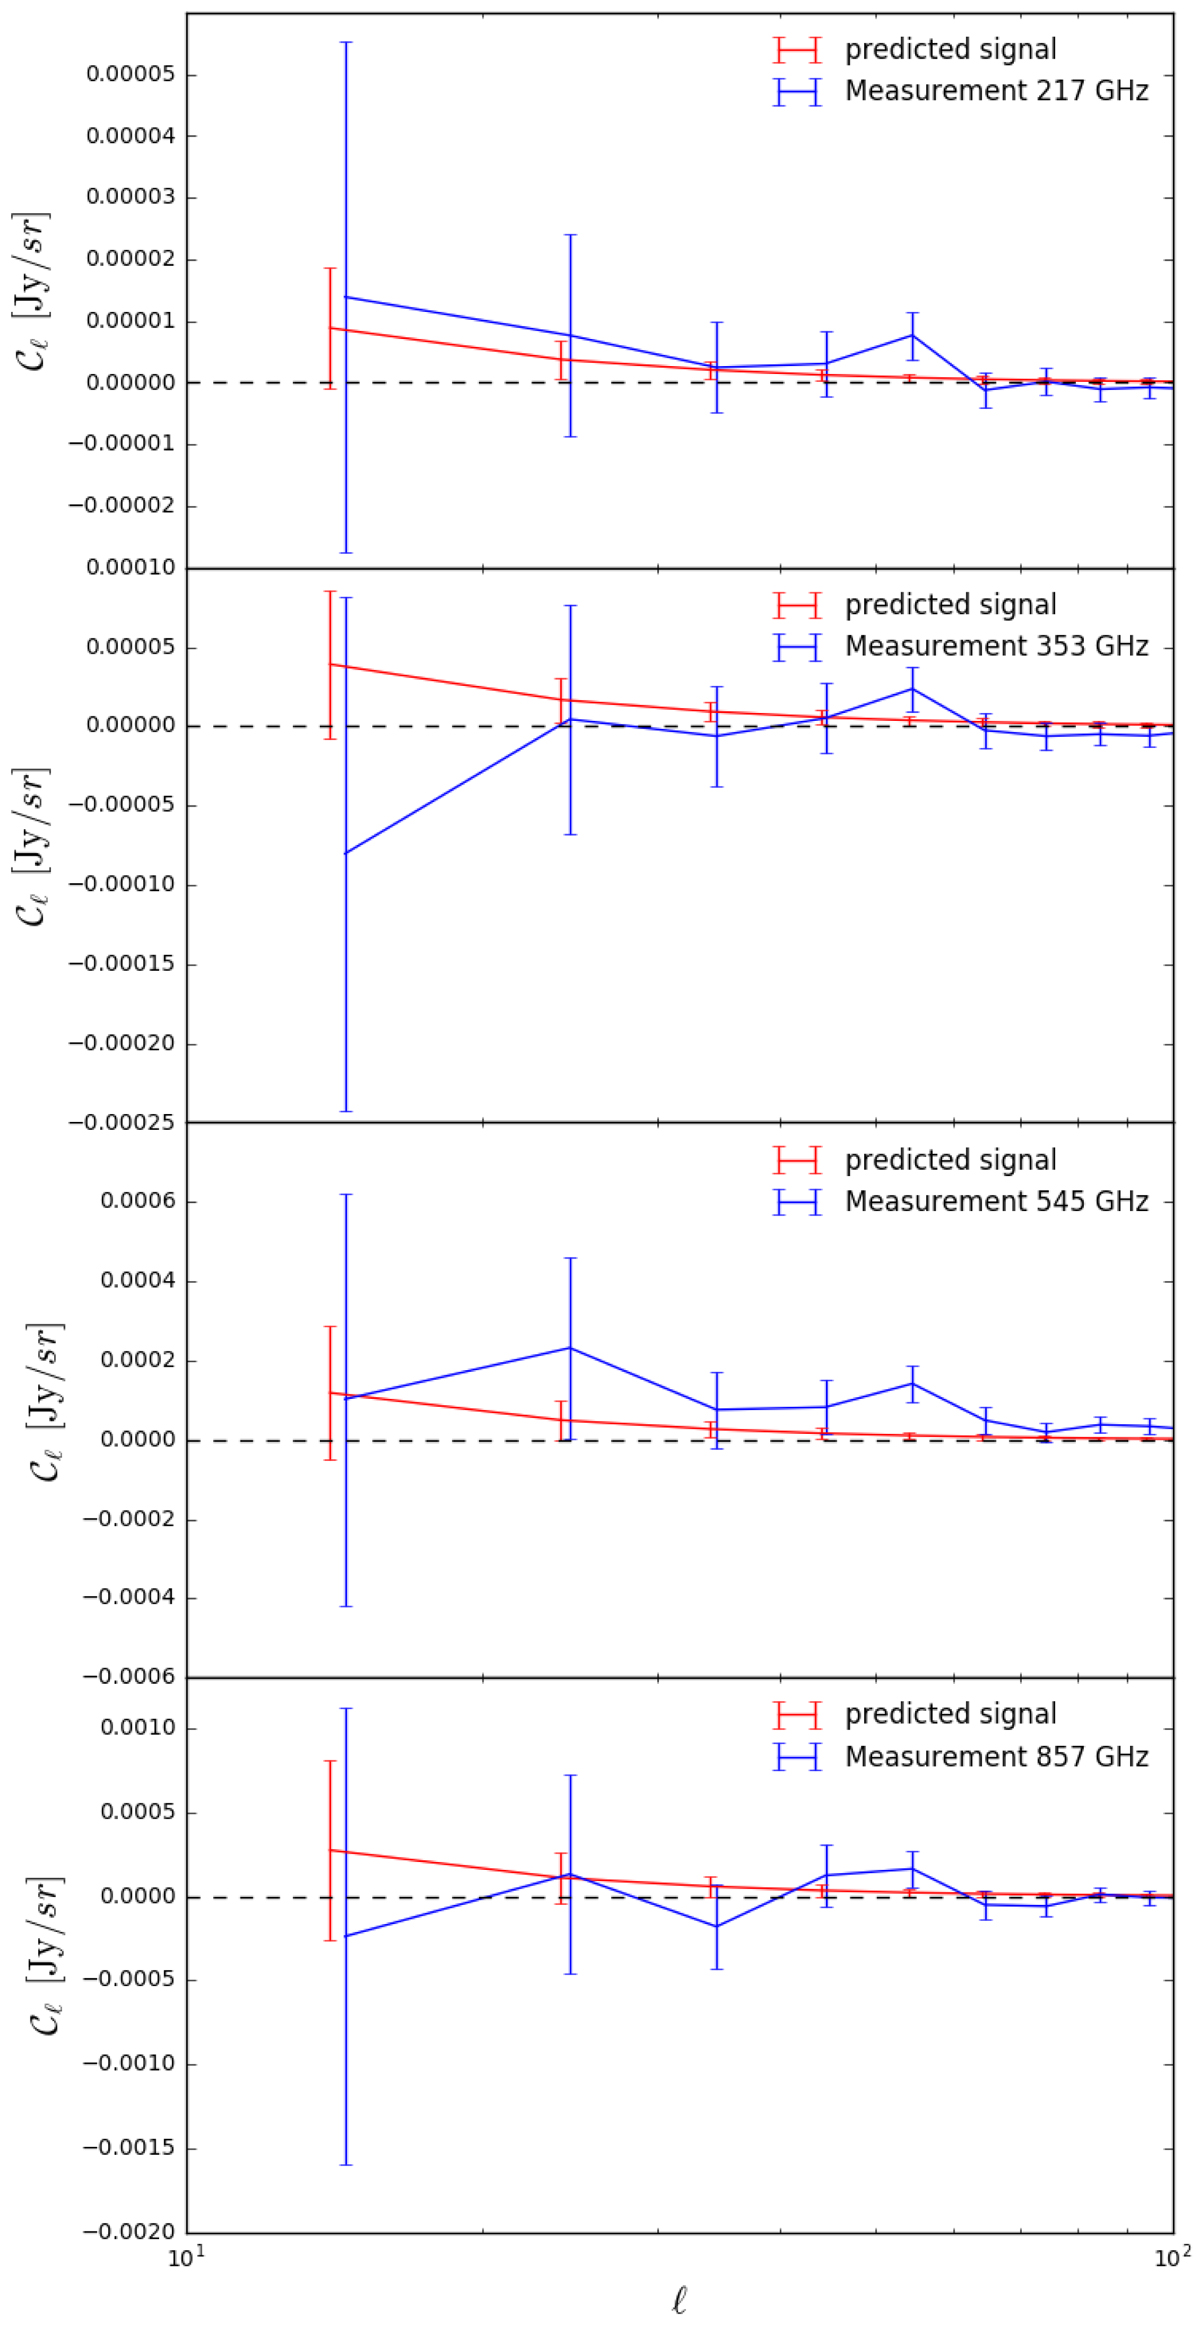
Measured CIB×CMB cross-correlation and corresponding error bars for the GASS CIB field (blue points). The predicted signal (given by Eq. (11)) is shown in red. The error bars on the predicted signal are calculated using the noise term in Eq. (39). Following Planck Collaboration XXX (2014), we assumed that the CIB power spectrum is contaminated by dust residuals at the level of 10% when the theoretical error bars were calculated.
Current usage metrics show cumulative count of Article Views (full-text article views including HTML views, PDF and ePub downloads, according to the available data) and Abstracts Views on Vision4Press platform.
Data correspond to usage on the plateform after 2015. The current usage metrics is available 48-96 hours after online publication and is updated daily on week days.
Initial download of the metrics may take a while.