Fig. 5.
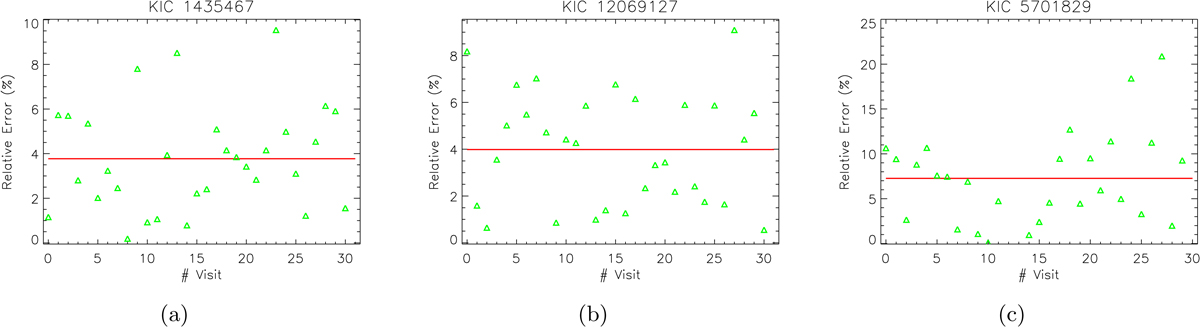
Relative error of νmax, w calculated with a one-day run, a 80% duty cycle, and taking into account case C1. Only those significant and inside the detection range values are shown. From left to right, we show the results of an MS star (panel a), a sub-giant (panel b), and a RGB star (panel c). The red line is the relative error of the mean νmax, w.
Current usage metrics show cumulative count of Article Views (full-text article views including HTML views, PDF and ePub downloads, according to the available data) and Abstracts Views on Vision4Press platform.
Data correspond to usage on the plateform after 2015. The current usage metrics is available 48-96 hours after online publication and is updated daily on week days.
Initial download of the metrics may take a while.