Fig. 2.
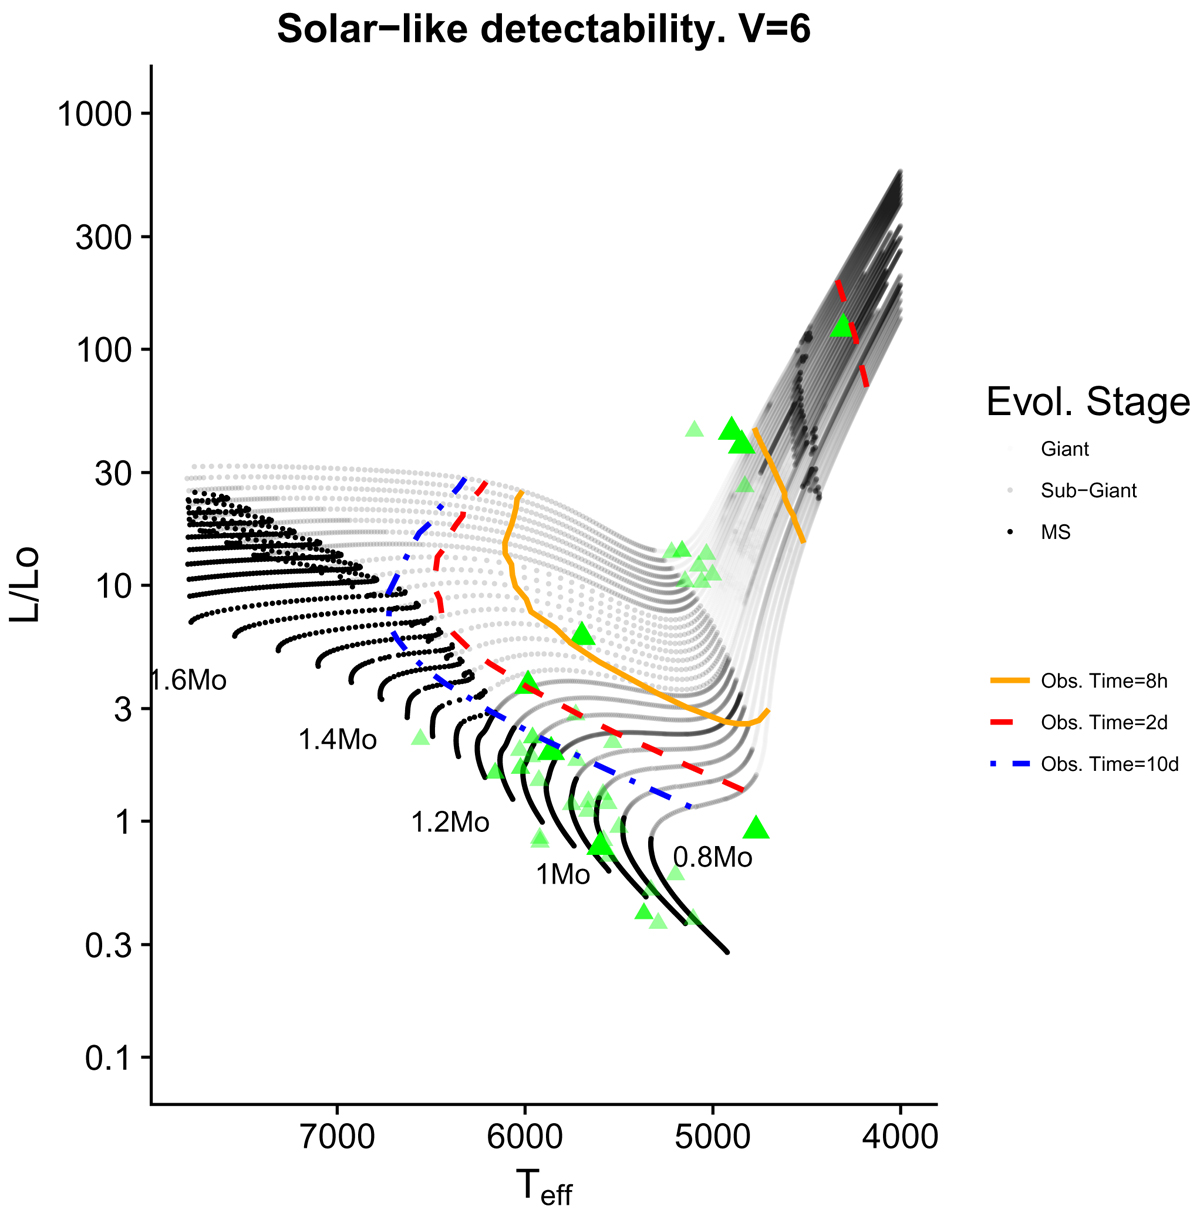
HR diagram showing the region where νmax can be determined, for a star with magnitude V = 6, using different observational times. Black points show the models used aligned in different evolutionary tracks. The evolutionary stage of these models are represented in different point transparency: MS stars in black, sub-giant dark gray, and giant in light gray. The orange lines are the bottom and top limits of the potentially νmax detection region for eight hours of observational time (respectively red lines – two days of observational time, blue lines – ten days of observational time). The upper detectability limit for an observational time of ten days is outside the plotted range. The position of the current known stars with planets in the ecliptic plane with V < 6 is shown using green triangles. The small and more transparent green triangles are those known stars with planets in the ecliptic plane with 6 < V < 9.
Current usage metrics show cumulative count of Article Views (full-text article views including HTML views, PDF and ePub downloads, according to the available data) and Abstracts Views on Vision4Press platform.
Data correspond to usage on the plateform after 2015. The current usage metrics is available 48-96 hours after online publication and is updated daily on week days.
Initial download of the metrics may take a while.