Fig. 4.
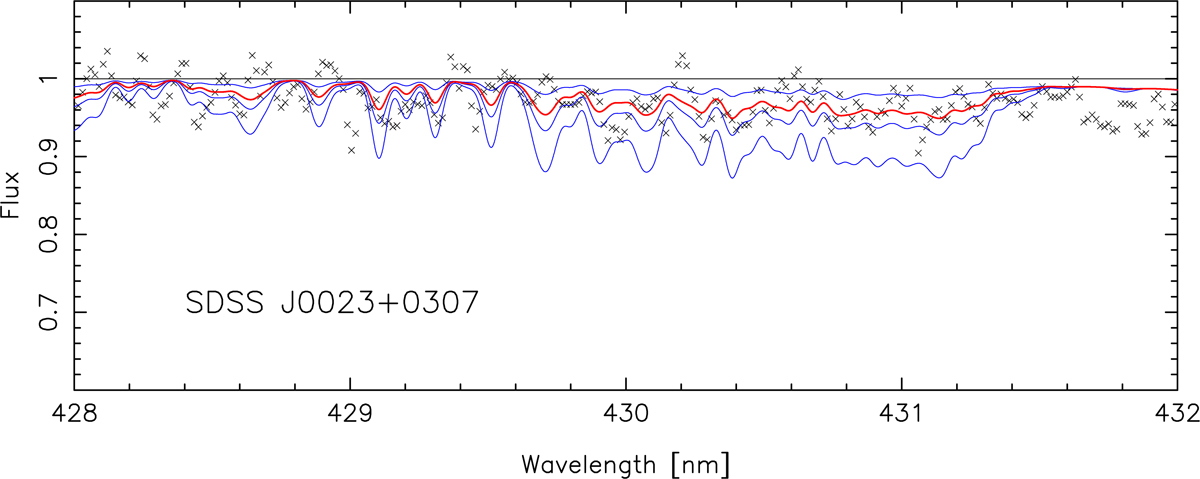
Synthetic spectra of SDSS J002314.00+030758.0 in the region of the CH G-band (continuous lines) superimposed on the observed spectrum (small crosses). The theoretical spectra are represented as blue lines correspond to carbon abundances A(C) = 6.0, 6.6 and 6.9 dex. The red line represent the best fit to the observed spectrum and corresponds to a carbon abundance A(C) = 6.4 dex.
Current usage metrics show cumulative count of Article Views (full-text article views including HTML views, PDF and ePub downloads, according to the available data) and Abstracts Views on Vision4Press platform.
Data correspond to usage on the plateform after 2015. The current usage metrics is available 48-96 hours after online publication and is updated daily on week days.
Initial download of the metrics may take a while.