Fig. 2.
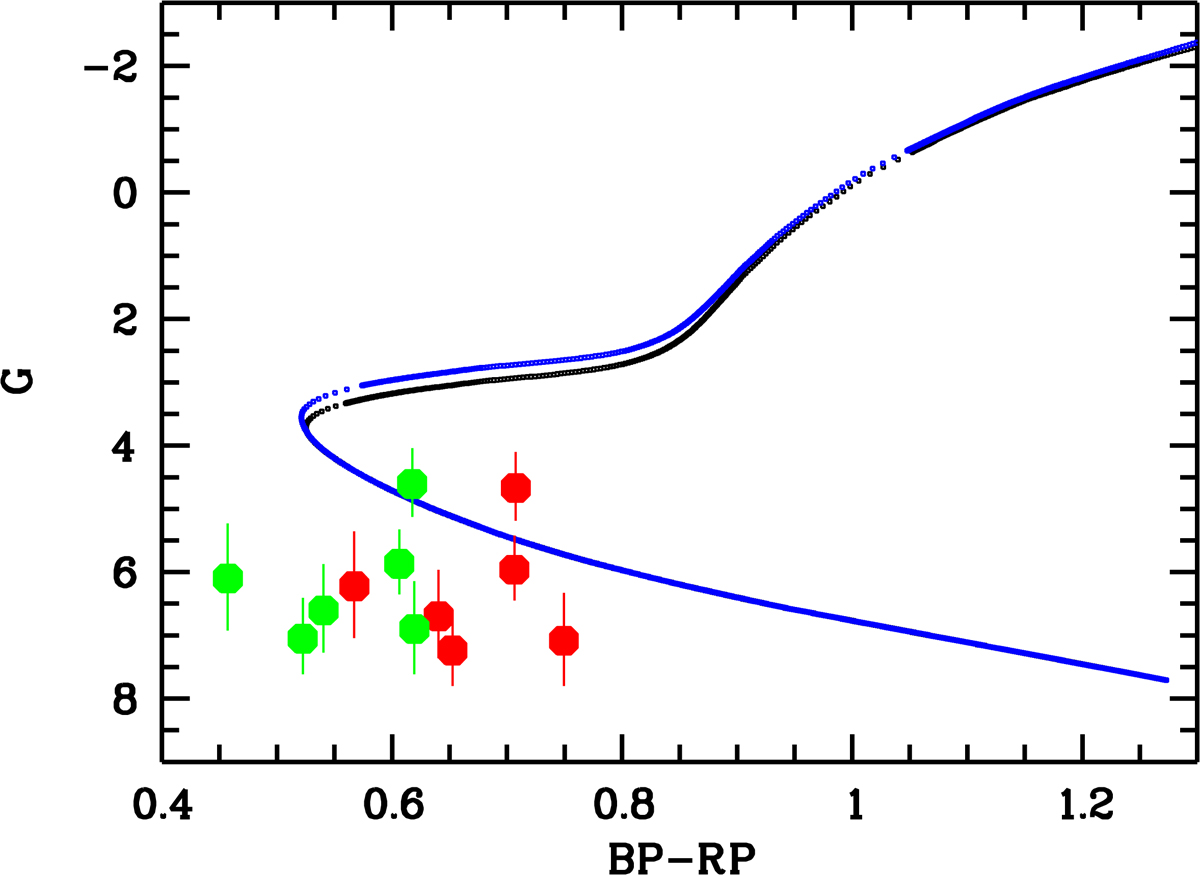
Comparison of the location of the stars and isochrones on a G magnitude versus (BP−RP) magnitude diagram. The two isochrones on the plot have been computed for an age of 14 Gyr (black line: z = 2 × 10⁻⁵ and blue line: z = 2 × 10⁻⁶). BP−RP (BP and RP are the magnitudes measured respectively by the two low resolution spectrographs, the Blue Photometer (BP) and the Red Photometer (RP) onboard the Gaia satellite) versus the absolute G magnitude, with two different hypotheses for the reddening. The red dots represent the stars assuming E(BP − RP) = 0 whereas the green dots represent our stars’ photometry with an extinction correction E(BP−RP) using the E(B−V) correction of PanSTARRS (Chambers et al. 2016) and the conversion relations E(BP − RP) = E(B − V) + 0.07 and AG = AV = 3.1 × E(B − V) (where AG and AV are the extinction in the G and the V band) from Andrae et al. (2018).
Current usage metrics show cumulative count of Article Views (full-text article views including HTML views, PDF and ePub downloads, according to the available data) and Abstracts Views on Vision4Press platform.
Data correspond to usage on the plateform after 2015. The current usage metrics is available 48-96 hours after online publication and is updated daily on week days.
Initial download of the metrics may take a while.