Open Access
Fig. 9.
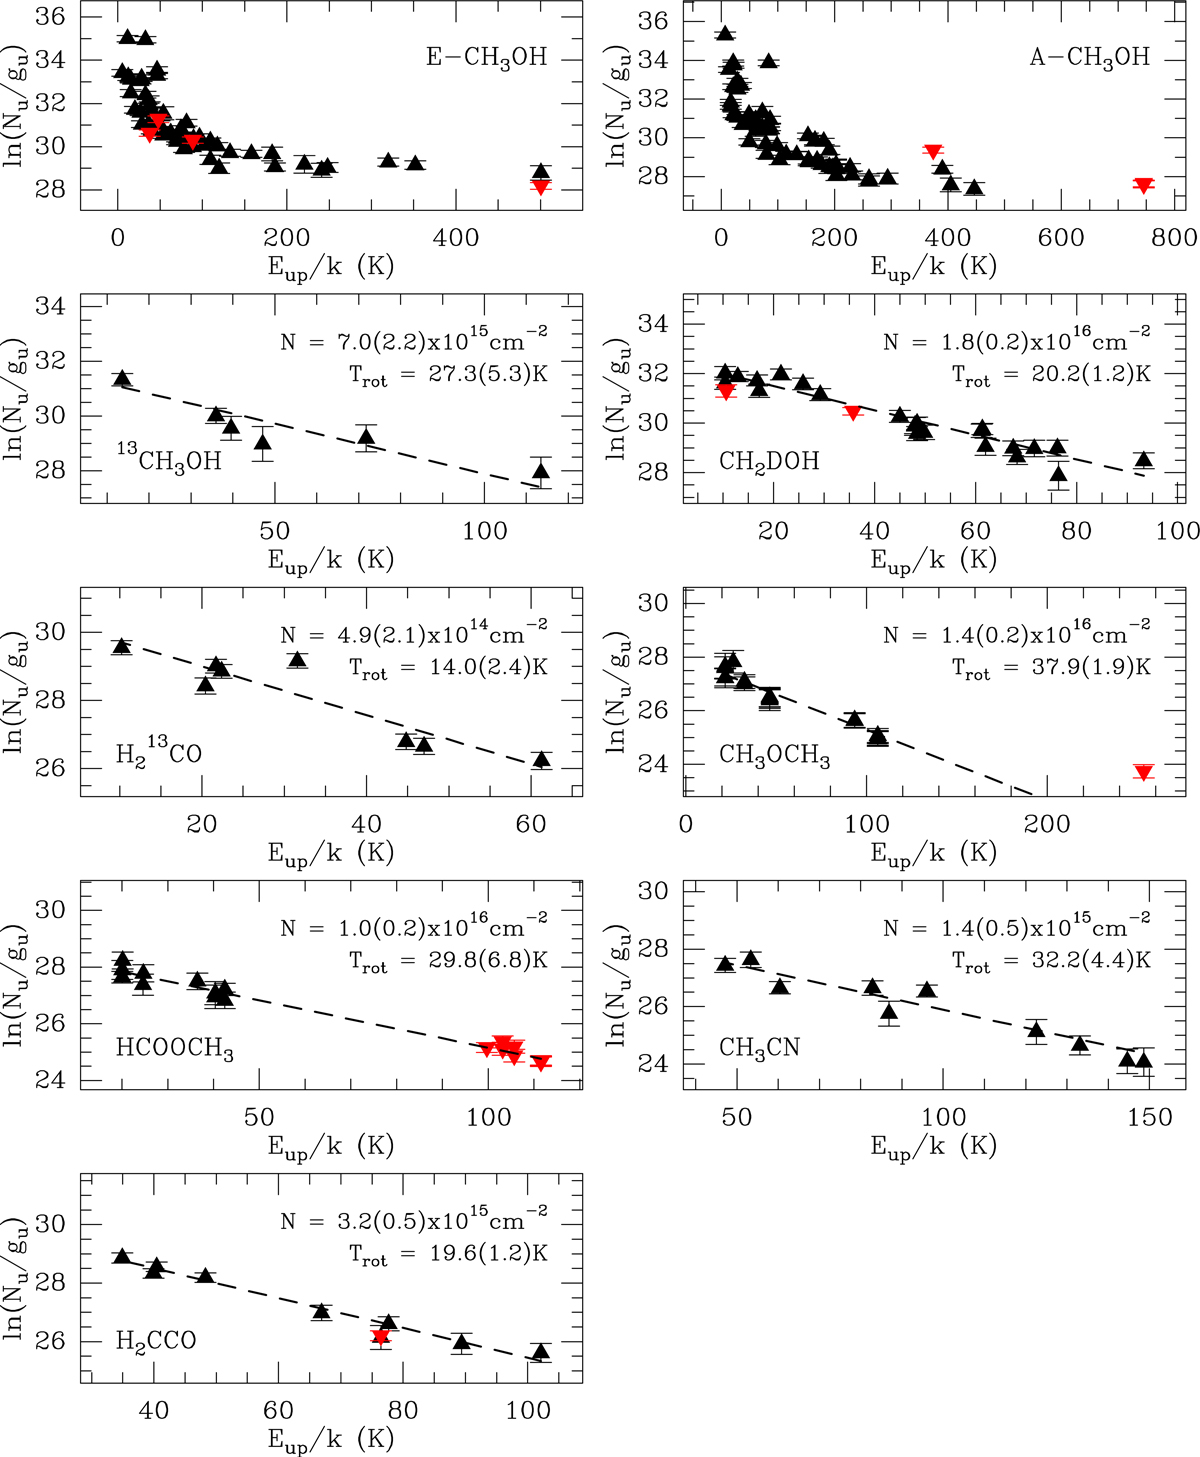
Population diagram analysis of the COMs detected in the hot corino of Cep E-A. A size of 0.7″ was assumed, except for ![]() (1.2″). Black (red) triangles represent the IRAM 30 m (NOEMA) fluxes. The best fitting solution using only the 30 m fluxes is drawn as a black dashed line.
(1.2″). Black (red) triangles represent the IRAM 30 m (NOEMA) fluxes. The best fitting solution using only the 30 m fluxes is drawn as a black dashed line.
Current usage metrics show cumulative count of Article Views (full-text article views including HTML views, PDF and ePub downloads, according to the available data) and Abstracts Views on Vision4Press platform.
Data correspond to usage on the plateform after 2015. The current usage metrics is available 48-96 hours after online publication and is updated daily on week days.
Initial download of the metrics may take a while.